
Figure 3.
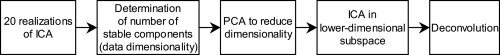
Schematic representation of the data processing steps. Twenty ICA decompositions are applied to the preprocessed data, and the number of reproducible components is determined. An additional ICA is then performed in the lower‐dimensional subspace extracted by PCA, and whose dimension is determined by the number of stable components. A deconvolution method is then applied to identify components related to the simulated spikes.