
Figure 6.
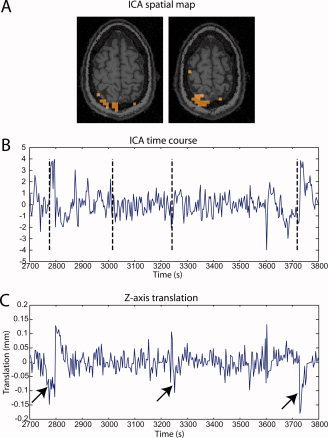
(A) Two slices of a typical spatial map of a significant component that was not concordant with the simulated activation region. The activation cluster at the edge of the brain suggests a residual motion artifact. (B) Part of the time course of the same component, with vertical dashed bars showing the timings of the simulated spikes. Sharp transients follow some of the spike timings. (C) Translation in the z‐direction determined from the motion correction preprocessing step. The arrows show that the transients found in panel B seem to correspond to residual motion artifacts. [Color figure can be viewed in the online issue, which is available at www.interscience.wiley.com.]