
Figure 7.
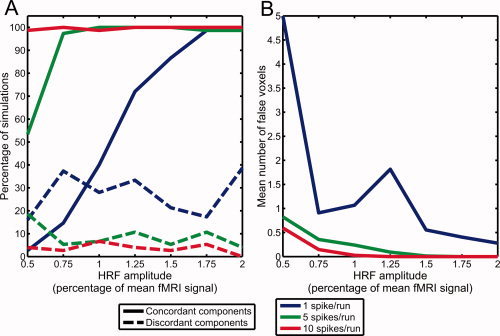
(A) Percentage of simulations with constant HRF amplitudes where significant components were found, either correctly matching the simulated activation region (concordant components) or at another location (discordant components). (B) Mean number of falsely activated voxels in concordant components.