
Fig. 1.
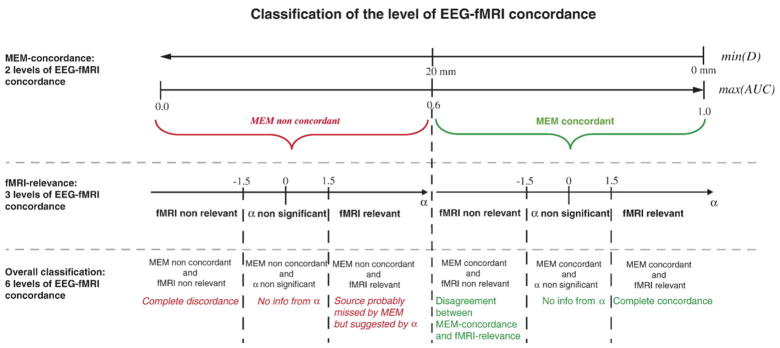
Summary of the method to classify the six levels of EEG-fMRI concordance for each fMRI cluster according to MEM-concordance (min(D) and max (AUC)) and fMRI-relevance (α). For MEM concordant results, the interpretation of the corresponding classification according to α (fMRI non-relevant, α non-significant and fMRI relevant) is presented using green font. For MEM non-concordant results, the interpretation of the corresponding classification according to α(fMRI non-relevant, α non-significant and fMRI relevant) is presented using red italic font.