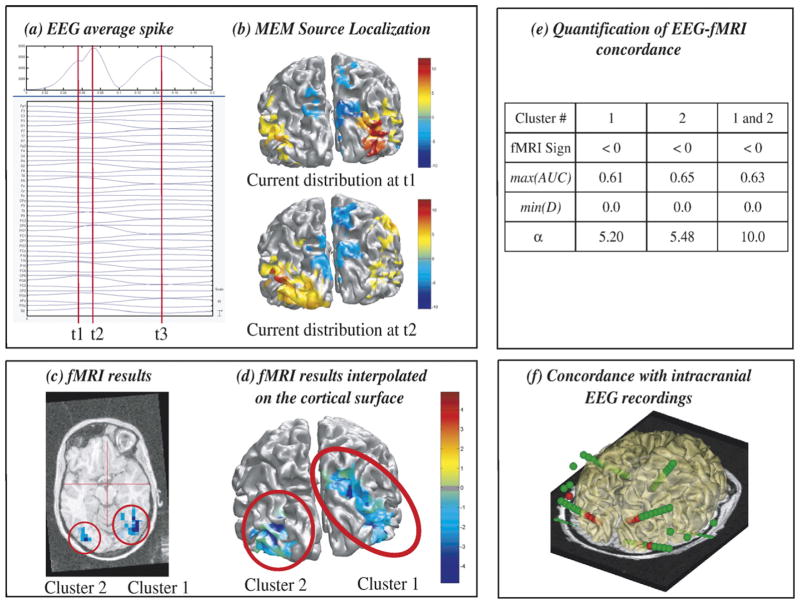
Fig. 2.
Analysis of patient 3 showing excellent EEG-fMRI concordance. (a) Signal and maximum field power of the average spike, local peaks (t1, t2, t3) considered for MEM-concordance are represented using red vertical lines. (b) MEM source localization estimated at t1 and t2, the positive and the negative parts of ĴMEM being thresholded upon the level of background activity, using Otsu’s threshold estimated on |ĴMEM| (Otsu, 1979). (c) t-values of the two most significant fMRI clusters obtained with the HRF peaking 5 s after the spike, superimposed on the 3D anatomical MRI. (d) Same fMRI clusters after interpolation onto the cortical surface. (e) MEM-concordance and fMRI-relevance metrics for cluster 1, cluster 2 and when considering both clusters together. (f) 3D representation of the position of the intracranial EEG electrodes with one MRI axial slice and the cortical surface (yellow slightly transparent), active contacts being represented in red. Visual inspection (b and d) and quantitative results (e) showed an excellent EEG-fMRI concordance within right and left occipital regions, and were confirmed by intracranial EEG recordings (f).

