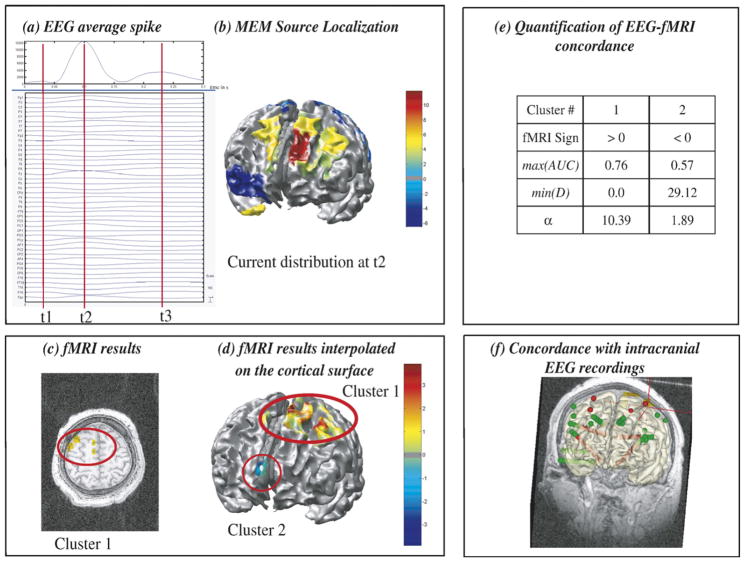
Fig. 4.
Analysis of patient 8 showing partial EEG-fMRI concordance. (a) Signal and maximum field power of the average spike, local peaks (t1, t2, t3) considered for MEM-concordance are represented using red vertical lines. (b) MEM source localization, thresholded as in Fig. 2b, estimated at the main peak of the spike t2. (c) t-values of the two most significant fMRI clusters obtained with the HRF peaking 5s after the spike, superimposed on the 3D anatomical MRI. (d) Same fMRI clusters after interpolation onto the cortical surface. (e) MEM-concordance and fMRI-relevance metrics for cluster 1 and cluster 2. (f) 3D representation of the position of the intracranial EEG electrodes with one MRI coronal slice and the cortical surface (yellow slightly transparent), active contacts being represented in red. EEG source localization, fMRI and intracranial EEG results showed a complex and widespread distribution of the activity involved at the time of the spike. However, excellent EEG-fMRI concordance was found within a widespread left frontal source (fMRI cluster 1). No MEM source was found concordant with the right anterior cingulate BOLD deactivation (cluster 2), although α=1.89 suggested that sources located in this region could explain some scalp EEG data, which was confirmed by intracranial EEG results (f).

