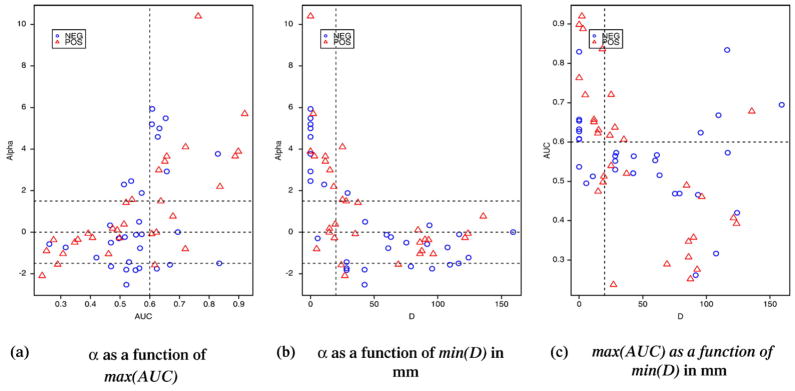
Fig. 6.

Distributions of MEM-concordance (min(D) and max(AUC)) and fMRI-relevance (α) metrics for all the 62 clusters considered in this study. Clusters corresponding to activations are represented in red triangles, and deactivations in blue circles. Thresholds used for classification are displayed using dashed lines. There is overall a good agreement between α, min(D) and max(AUC) and they are uniformly distributed over their whole range of values. In most cases, fMRI-relevance was then in agreement with MEM-concordance and all levels of EEG-fMRI concordance were observed. More discrepancies were observed between max(AUC) and min(D), especially for highest min(D) values (c), suggesting that these two metrics were complementary and necessary to quantify MEM-concordance.
