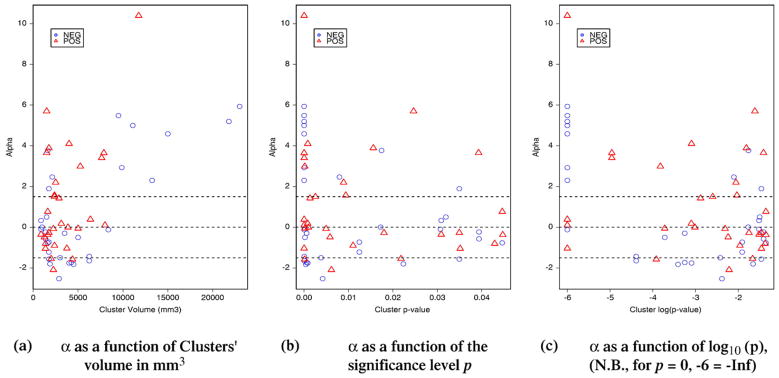
Fig. 7.

Distribution of the fMRI-relevance index α as a function of: (a) the volume of each cluster, (b) the corrected significance level of the cluster p and (c) its logarithm log10(p). Each point corresponds to one of the 62 clusters considered in this study. Clusters corresponding to activations are represented in red triangles, and deactivations in blue circles. Thresholds used for classification are displayed using dashed lines. Almost all the largest fMRI clusters (volume>10 mm3) were highly relevant for EEG source localization (α>1.5). The fMRI responses concordant with EEG were either activation or deactivation, also fMRI clusters showing deactivation tend to be slightly larger than the ones showing activations (a).
