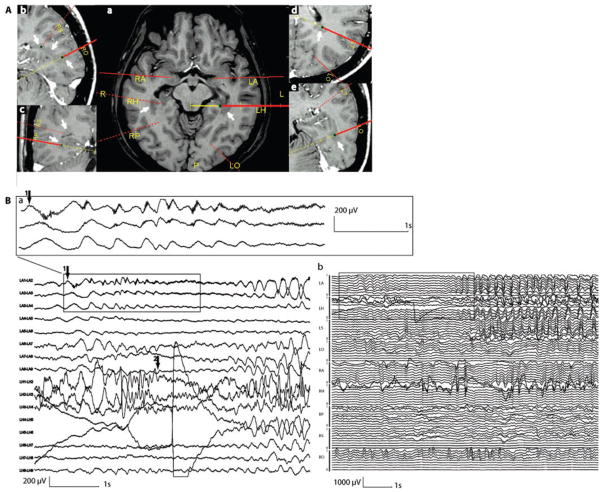
Fig. 1.
Intracranial recording for Patient 4. (A) Electrodes positioning planned with a neuronavigation system (yellow lines indicate the planned direction of the electrodes path, the red lines represent the electrodes). On axial (a and d), sagittal (b and e) and coronal (c) MRI, heterotopic nodules (white arrows) were targeted by RH, LH, RP, RS, LO, RO and LT. RA and LA did not reach any nodule. (B) One example of a clinical seizure starting from the left amygdala (arrow 1) recorded during intracranial study (a). Rhythmic short bursts of high-frequency oscillations started over LA1 and LA2 followed by an attenuation of the EEG signal dominated by this high-frequency activity. In LH1, LH2 and LH3 (2–3 probably in the nodule), a later attenuation of the background activity (arrow 2) followed by a 8 Hz spiking activity is observed. A regional 4 Hz discharge involved then all LA contacts and to a lesser extent the last LH contacts and later LT contacts. The seizure remained only on the left side with involvement of all the contacts (b). LA = left amygdala; RA = right amygdala; LH = left hippocampus; RH = right hippocampus; RP = right parahippocampus; LT = left trigonal area; RS = right supra marginal gyrus, LO = left occipital; RO = right occipital.

