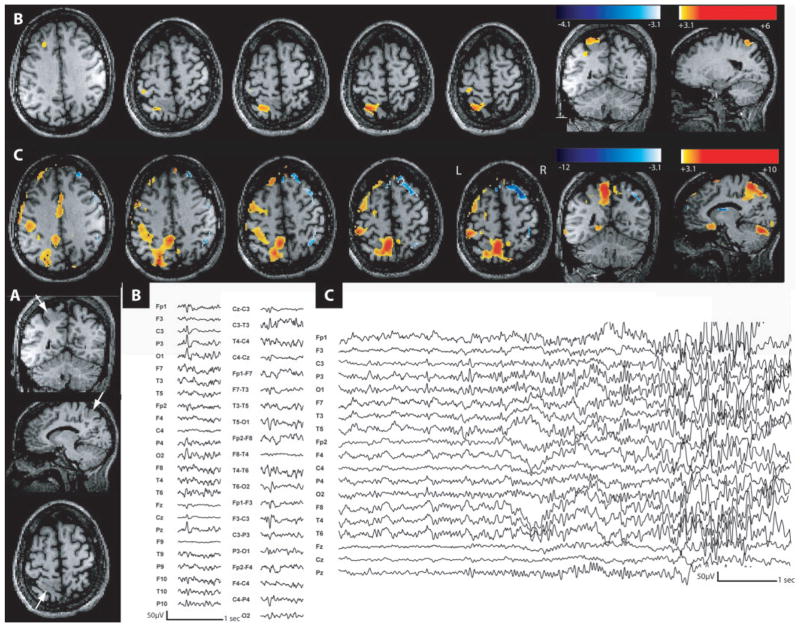
Fig. 6.
Focal cortical dysplasia (Patient 6). (A) Anatomical MRI showed a left centroparietal dysplasia (head of the white arrows). (B) Activation in the dysplasia during C3–P3 spikes. (C) BOLD signal changes induced by single seizure. Maximum activation is again in the lesion. Ictal event starts by a C3–P3– O1 spike activity followed by left parietal fast activity. For both types of events, the activation involved the dysplasia. Concerning the ictal event, BOLD increase is more diffuse and involved the entire dysplasia and connected areas.

