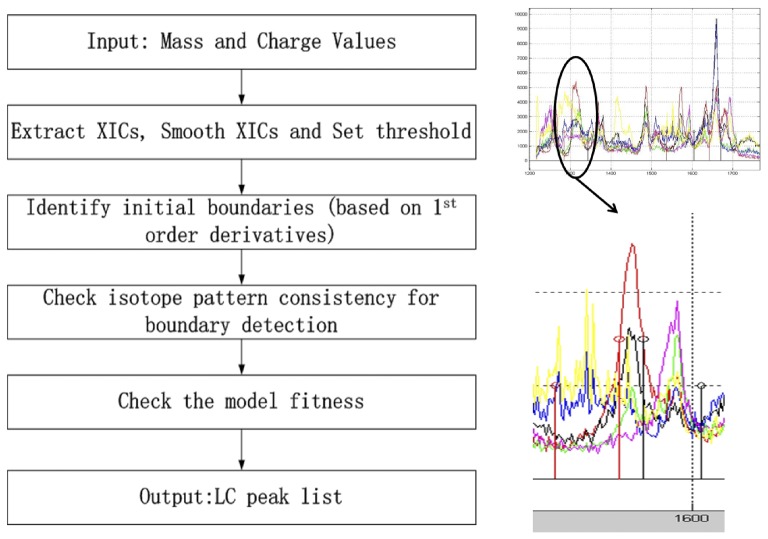
Figure 1. Flow Diagram of LC/MS Processing Steps.
The right top panel shows a segment of XICs at different isotope positions of a peptide. There exists interference of co-eluting peptides. After processing, as shown in the bottom right panel, we determine the boundary of the LC peak (indicated by the stem pairs in the middle), that excludes segments which have been corrupted by signals of co-eluting peptides. The initial boundary (indicated by the lower pair of stems) includes a lot of interference from co-eluting peptides.

