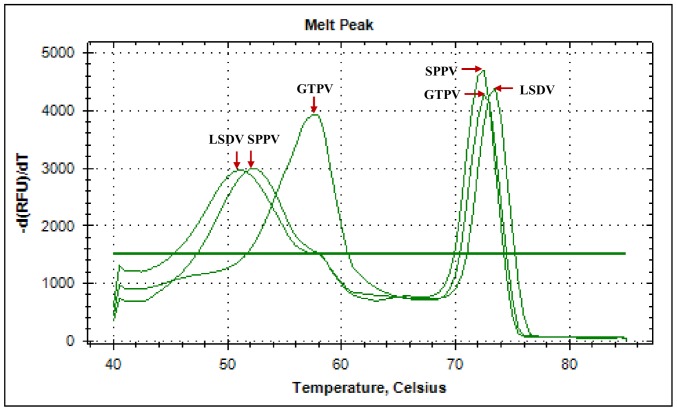
Figure 4. Snapback primer genotyping of CaPVs.
The fluorescence melting curve analysis of the PCR products shows two melting peaks for each of the CaPV three genotypes (GTPV, SPPV and LSDV) corresponding to the snapback stem melting peak at lower temperature and the full-length PCR amplicon melting peak at higher temperature (see arrows).

