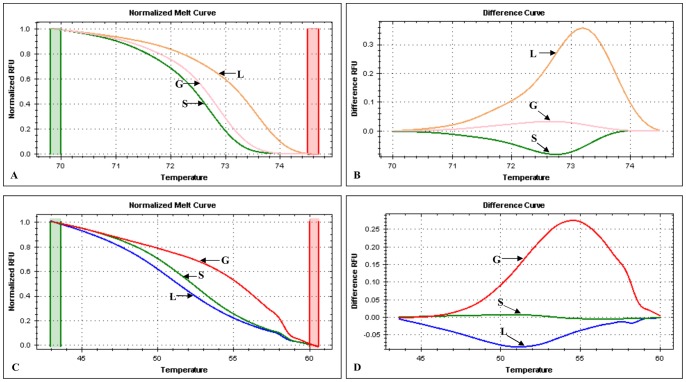
Figure 5. High-Resolution melting curve analysis of CaPVs using the Precision Melt Analysis™ software (BioRad).
A: the normalized melt curve of the full-length amplicon; B: the difference curve of full-length amplicon; C: the normalized melt curve of snapback stem; D: The difference curve of the snapback stem. The species are indicated by the arrows: G = GTPV, S = SPPV and L = LSDV.

