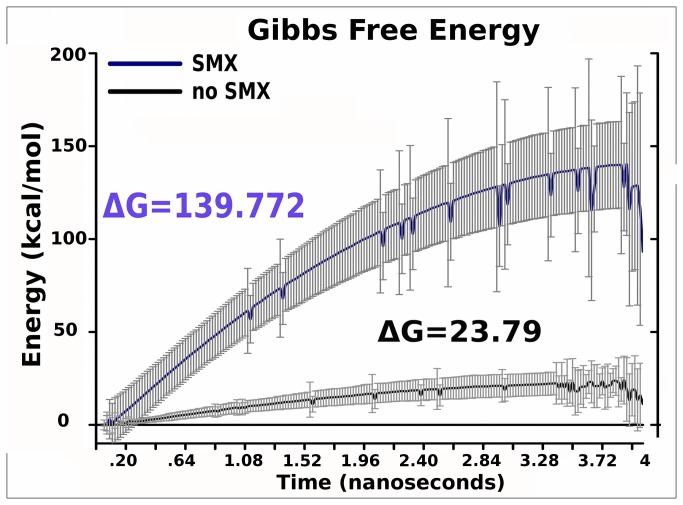
Figure 3. Total Free Energy Change.
Free energy calculated from all simulations. Grey bars, standard deviation, Means colored lines, purple SMX, black without SMX, energy is in kcal/mol. Final SHAM calculated free energy changes are indicated on graph as ΔG for the forward reaction, taken at 3.8 ns. The TCR in each simulation set becomes completely disengaged from the pHLA between 3.2-3.4 ns, which is more apparent in simulation paths without SMX.

