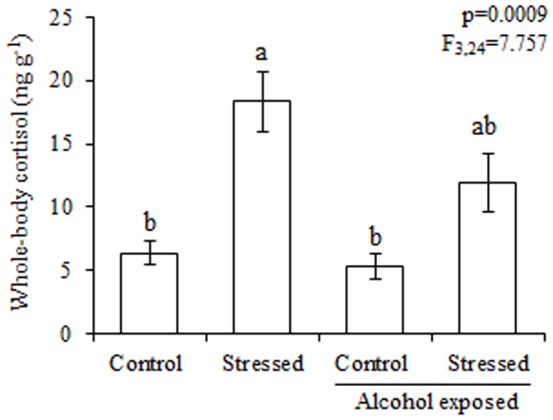
Figure 4. Whole-body cortisol measured in control and stressed fish that were either untreated or exposed to 0.50% alcohol.

The values are expressed as the mean ± standard error of mean. Different letters above the histograms indicate significant differences between means (ANOVA, followed by Tukey’s multiple range test, see details in the text).
