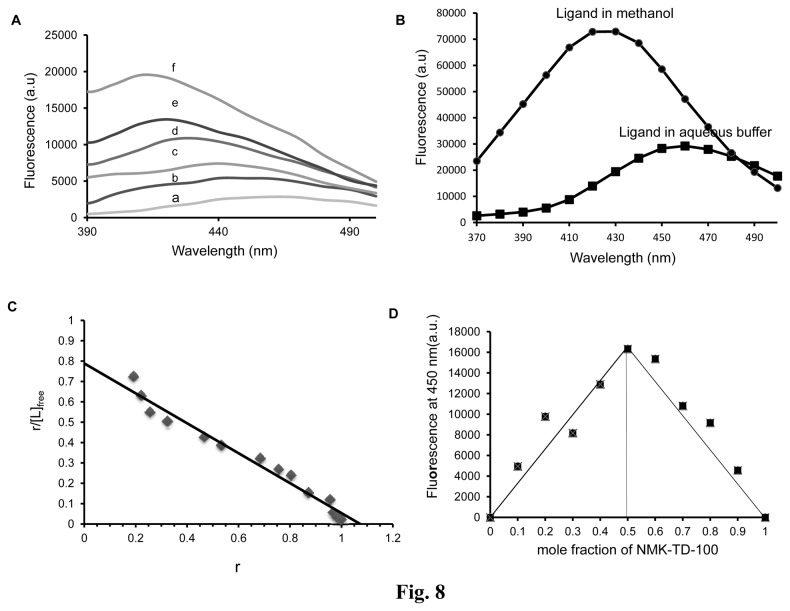
Figure 8. Binding of NMK-TD-100 to tubulin as assessed by enhancement of ligand fluorescence.
(A) Fluorescence emission spectra of NMK-TD-100 (2 µM) in buffer (curve a) and in the presence of 2 (curve b), 5 (curve c), 7.5 (curve d), 10 (curve e) and 15 (curve f) µM of tubulin. (B) Fluorescence emission spectra of NMK-TD-100 (20 µM) in the presence of aqueous buffer (PEM buffer) and methanol. (C) Scatchard Plot of NMK-TD-100 binding to tubulin. (D) Job Plot for binding of NMK-TD-100 to tubulin. The concentrations of NMK-TD-100 and tubulin were varied continuously whereas the total concentration of tubulin and NMK-TD-100 was kept fixed at 5 µM. The corrected fluorescence value at 450 nm was plotted against the mole fraction of NMK-TD-100. The excitation and emission wavelengths were 340 and 450nm respectively for all the above panels. Data are representative of three similar experiments. Details of all the experiments are described in the ‘Materials and methods’ section.

