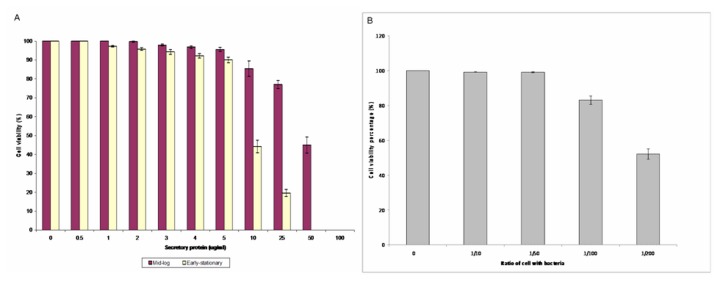
Figure 3. Percentage of A549 lung epithelial cells exposed to (panel A) secretory proteins (mid-logarithmic and early-stationary phases) ranging from 0 µg/ml-100 µg/ml and (panel B) live B. cepacia (mid- logarithmic phase) for three hours from 1:10 -1:200 using Trypan blue solution.

The error bars indicate the standard deviation of triplicate values. The red box indicates the concentration choosen for microarray analysis.
