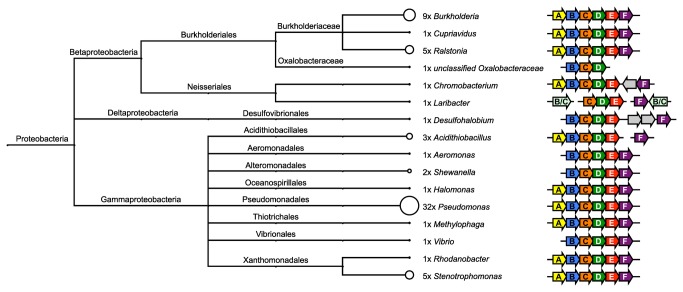
Figure 1. Phylogenetic Distribution of the Fap Systems and Operon Structure.
Taxonomic analysis was performed based on the NCBI taxonomy and visualized using MEGAN [37]. The number of strains containing Fap systems within each genus is indicated next to the taxa and illustrated through the diameter of the circle. Note that these numbers are highly influenced by the number of sequenced strains within each phylogenetic group and do not reflect the prevalence of Fap systems within these groups. Organization of the fap operons is illustrated for each genus.

