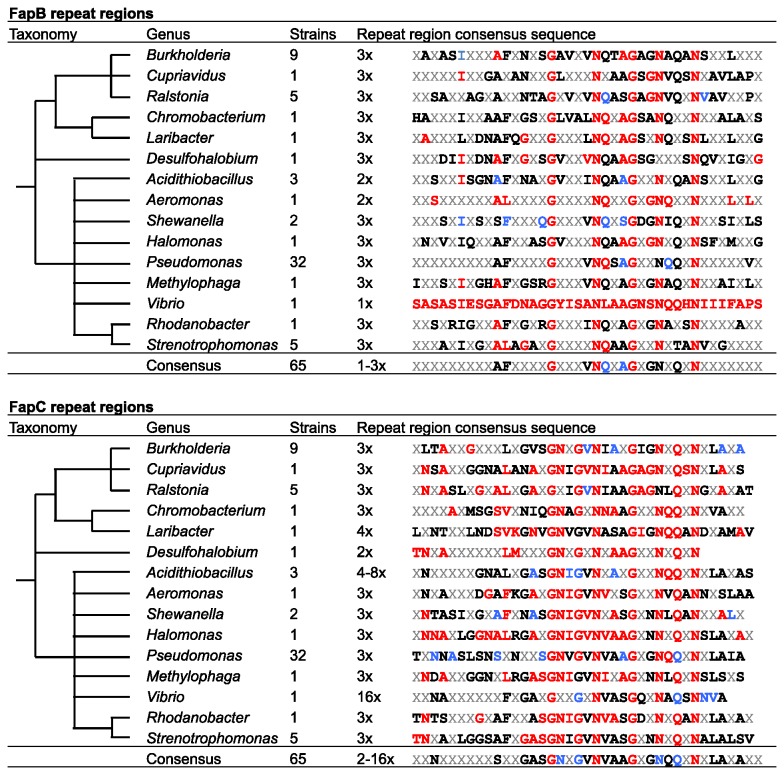
Figure 2. Comparison of Homologous FapB and FapC Repeat Regions.
The phylogeny is based on the NCBI taxonomy. Bold residues represent 50% (black), 80% (blue) and 100% (red) conserved residues. Note that the conservation is highly biased by the number of sequenced strains and internal repeat units within the Fap proteins of each genus.

