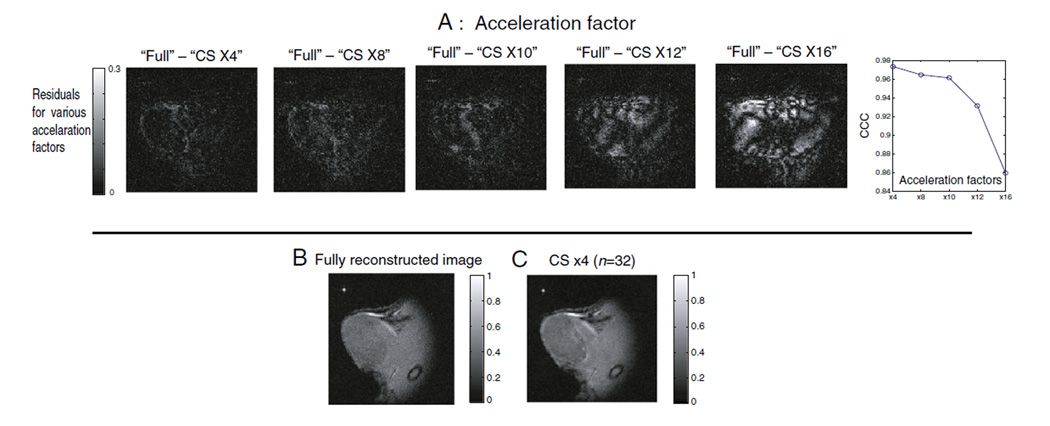
Fig. 3.
(A) Residual images and CCC values are plotted as a function of acceleration factors. For clear visualization, the maximum scale of residual plots was set to 30% of the maximum signal intensity of the fully reconstructed image. To calculate a representative number for the retained sparse coefficients for each of the CS reconstruction, fraction of coefficient of each CS-reconstructed image for each acceleration factor was divided by that of fully sampled image at 95% signal level. It shows that 88.46%, 80.05%, 77.90%, 76.18% and 71.19% of sparse coefficients of compressed representations were retained for ×4, ×8, ×10, ×12 and ×16 subsamplings for this animal tumor, respectively. (B) Fully acquired and reconstructed image. (C) CS (×4) reconstructed image with optimized parameters. In (B) and (C), fully reconstructed image was normalized to its maximum intensity voxel, and CS reconstructed images were normalized to the same value for their direct comparison.

