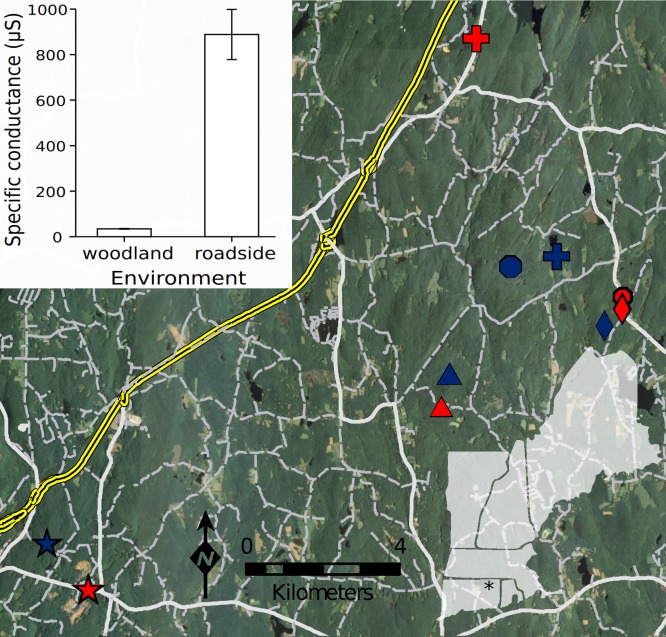
Figure 1. Population locations and reciprocal transplant design.
Locations of the 10 pools comprising transplants are shown. Asterisk on inset indicates approximate study location in northeastern Connecticut, USA. Like symbols indicate paired pools (red = roadside; blue = woodland). Interstate highway (I-84) and on/off-ramp infrastructure is indicated in yellow. Primary roads are heavily shaded, while secondary and unpaved roads are lightly shaded. Bar graph shows average specific conductance (µS; ±1 SE) in the woodland and roadside pools. From among a suite of abiotic variables, I found that pools differed only with respect to specific conductance, which indicates elevated ionic concentration, reflecting the increased presence of chloride ions in roadside pools that originate from road salt runoff.

