. 2012 Mar;20(2):177–182. doi: 10.4062/biomolther.2012.20.2.177

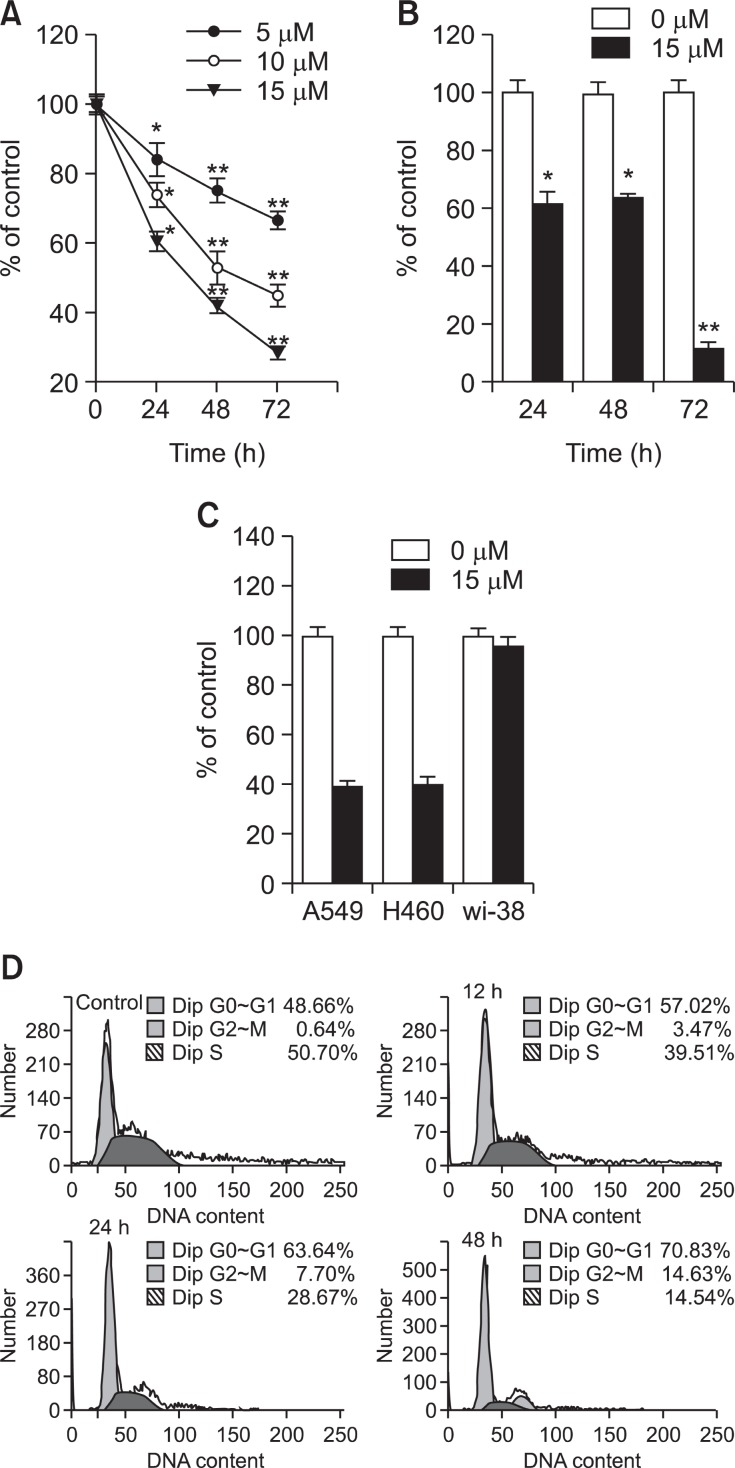
Fig. 2. Effect of TV on cell growth inhibition in A549 cells. A549 cells were treated with TV at 0, 5, 10, and 15 μM for 24, 48 and 72h, respectively. (A) Cell viability was assessed by the MTT assay. (B) Cell proliferation was assessed by the BrdU incorporation assay. Each data point is a mean of three independent experiments with six wells/concentration and is given as mean ± S.D. *p<0.05, **p<0.01 vs. controls. (C) Effect of TV on cell growth inhibition in A549, H460 and Wi-38 cells. A549 H460 and Wi-38 cells were treated with TV at 0, 15 μM for 48 h, respectively. Cell viability was assessed by the MTT assay. (D) Effect of TV on cell cycle distribution in A549 cells. A549 cells were treated with or without TV 15μM for 12 h, 24 h, and 48 h, harvested, fixed and stained with PI. The DNA content of the stained cells was analyzed by flow cytometry: Data are representative of three independent experiments with similar results.

Fig. 2.