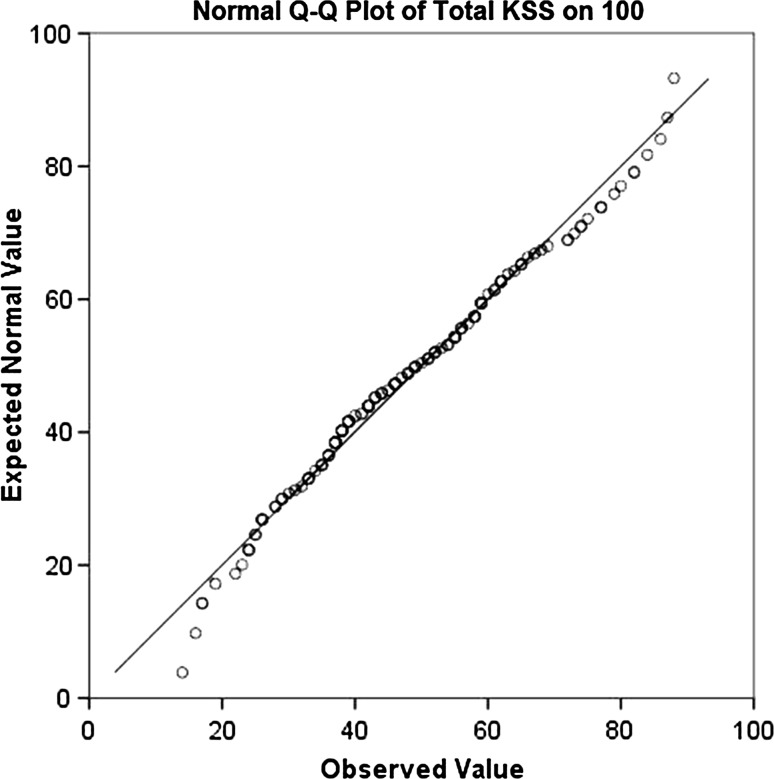
Fig. 1.
Distribution of the Dutch New KSS. The graph shows the normal distribution (normal Q-Q plot) of our patients’ total scores using the Dutch New KSS. Q = quantile. The calculated scores were normally distributed, and no ceiling or floor effect is observed at preoperative and short-term postoperative intervals.

