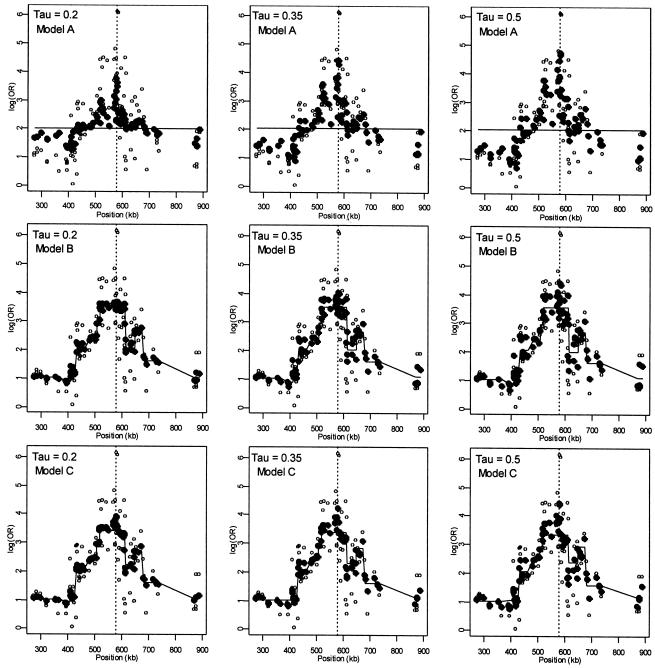
Figure 2.
Linkage disequilibrium patterns for the Daly et al. (2001) data using spatial relations only (model A), haplotype blocks (model B), and both spatial relations and haplotype blocks (model C). Unblackened circles (○) indicate the first-stage estimates of the log odds ratio. Blackened circles (●) indicate the HLD estimates from the corresponding hierarchical model. The solid lines are the second-stage regression coefficients,  . The vertical dashed line identifies the location of the “disease” locus at SNP 61 (579 kb).

