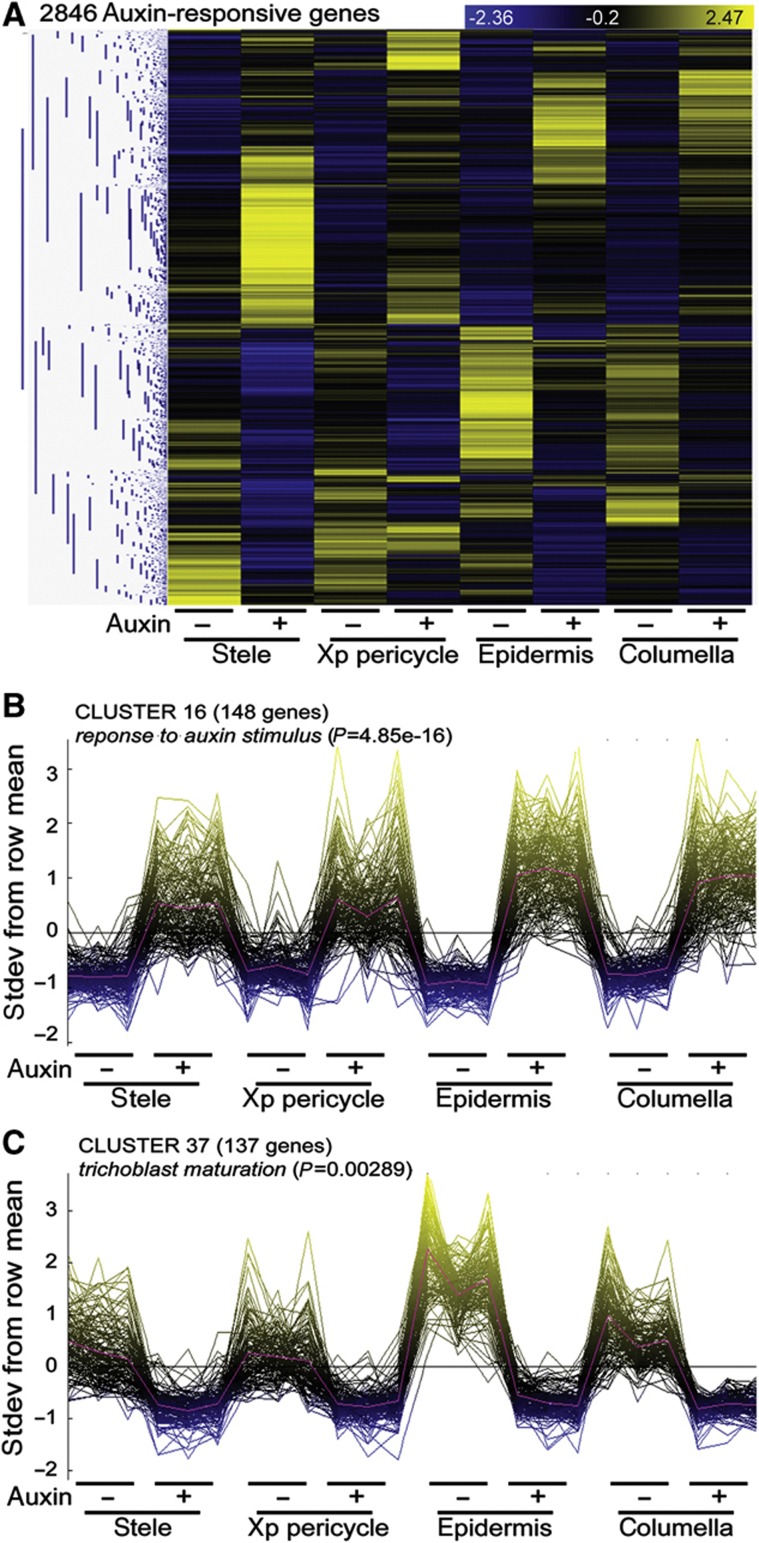
Figure 3.
Categorizing cell type-specific auxin responses. (A) Spatial auxin-response patterns arranged by hierarchical clustering (pairwise Pearson’s correlation). 2846 genes significantly regulated in the ANOVA for treatment or for the interaction between treatment and cell type (P<0.01) and in at least one t-test of the four separate tissues assayed (P<0.01, fold change>1.5). The heatmap consists of row-normalized gene expression in rows and cell type±treatment in columns; blue (low) to yellow (high) color code indicates standard deviations from the row mean. (B) Dominant expression pattern 16 contains 148 genes with relatively uniform upregulation after auxin treatment; the GO term response to auxin stimulus is overrepresented in this list of genes (corrected Fisher’s exact test). (C) Dominant expression pattern 37 contains 137 genes that show high expression in the epidermis and are repressed by auxin treatment; the GO term trichoblast maturation is overrepresented in this list of genes (see Supplementary Figure S4 and Supplementary Table S3).

