Figure 4.
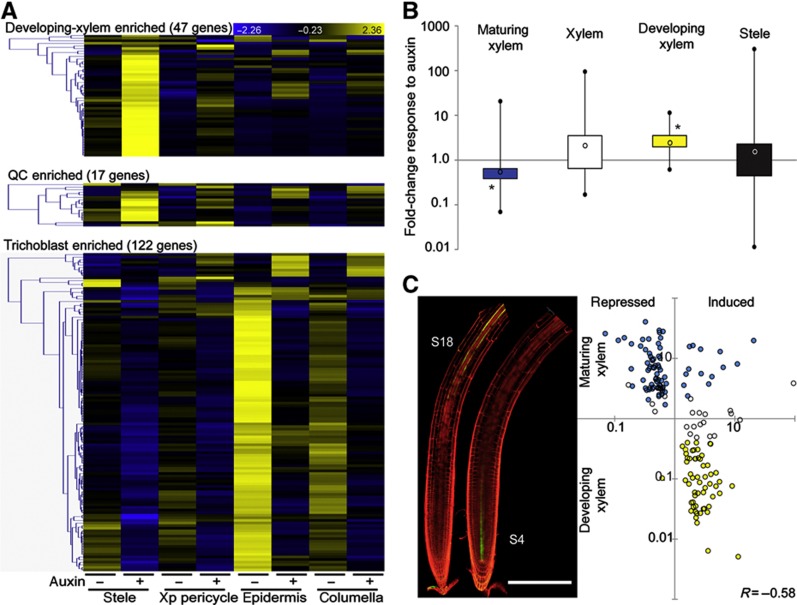
Auxin-responsive cell-identity markers. (A) Cell type-specifically enriched auxin-responsive genes show spatially distinct auxin responses. Heatmaps display the overlap between lists of cell type-specifically enriched genes (Supplementary Figure S2B; Supplementary Table S2) and the stringent list of 2846 auxin-responsive genes; blue (low) to yellow (high) color code indicates standard deviations from the row mean. Auxin-responsive developing-xylem-enriched genes (top panel) and QC-enriched genes (middle panel) are predominantly upregulated, specifically in the stele; auxin-responsive trichoblast-enriched genes (lower panel) are predominantly downregulated and highly expressed in the epidermis before treatment. (B) Boxplot representation of the fold-change distribution of maturing-xylem- (blue), xylem- (white) and developing-xylem- (yellow) enriched genes that significantly respond to auxin treatment in the stele (t-test P<0.01, all auxin-responsive genes in the stele are represented by a black box). Black circles represent minimum and maximum values, black lines represent the first and fourth quartiles, boxes represent the second and third quartiles, open circle represents the median; *P<1e−10 χ2-test for ratio of induced-to-repressed genes. (C) The S18 and S4 marker lines for maturing and developing xylem, respectively (left panel), were used to plot the fold change in expression upon auxin treatment in the stele versus the expression ratio between maturing and developing xylem for the 157 auxin-responsive (maturing and/or developing) xylem-enriched genes. Pearson’s correlation R=−0.58, scale bar indicates 250 μm.

