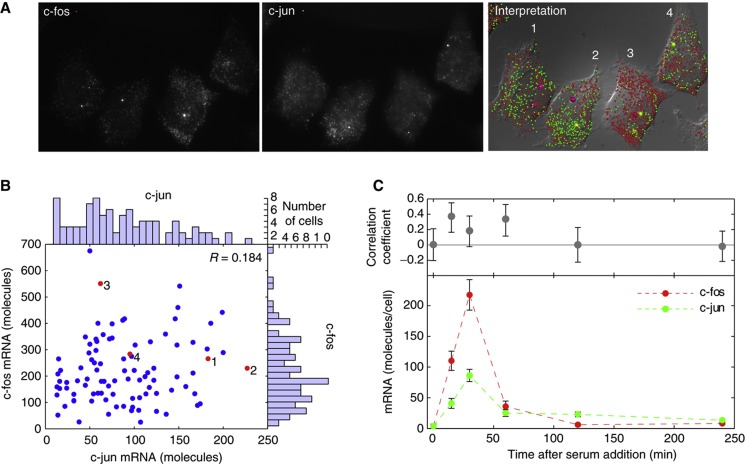
Figure 2.
The numbers of c-fos and c-jun mRNA molecules do not correlate with each other in individual cells. (A) Single-molecule FISH images of representative cells 30 min after the addition of serum to cells that were starved of serum for 48 h. The two left-hand panels are merged z-stacks, indicating the probes used; and the right-hand panel displays the identified mRNA molecules (small balls) and active gene loci (larger balls) on a diffraction interference contrast image. (B) The number of c-fos and c-jun mRNAs in 100 individual cells 30 min after serum stimulation. The red dots correspond to the data obtained from the four cells shown in the images. Marginal histograms show the distribution of each mRNA among the 100 cells that were examined. (C) Number of c-fos and c-jun mRNA molecules per cell as a function of time after the addition of serum and the correlation coefficients between them at each time point. Error bars represent the 95% confidence interval obtained from measurements made on 50–100 cells. Source data for this figure is available on the online supplementary information page.

