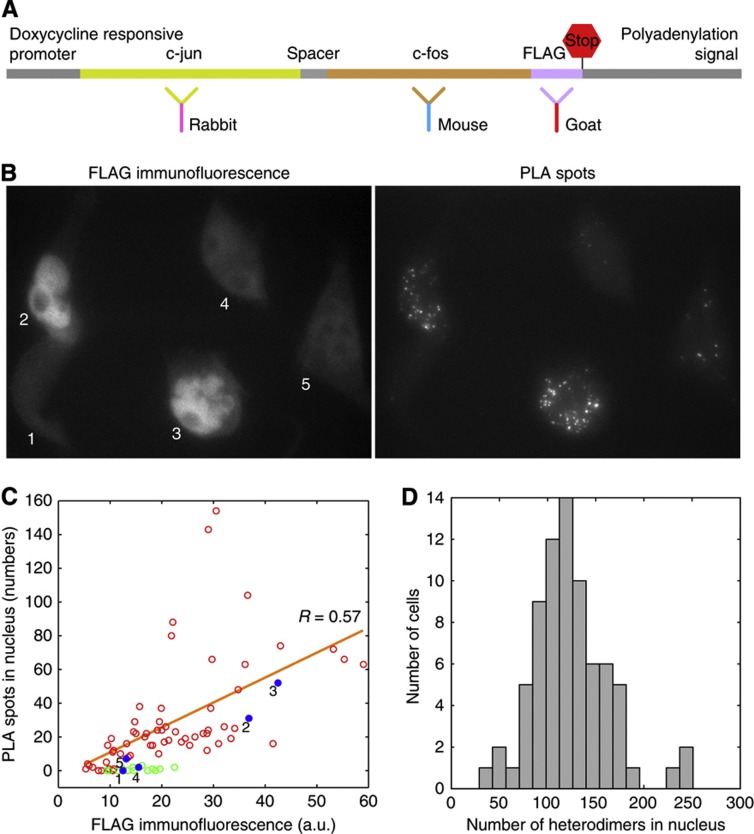
Figure 5.
A demonstration of the proportionality of number of PLA spots with the amount of component proteins and the distribution of PLA spots in HeLa cells. (A) Schematic illustration of an engineered construct in which a c-fos coding sequence was fused to a c-jun coding sequence and a FLAG tag was added at the C-terminal. This fusion protein was detected by PLA (using indicated c-fos and c-jun specific antibodies) and the FLAG tag was detected by direct immunofluorescence (IF) with the help of the indicated third antibody. (B) FLAG IF and PLA signals from the same field of cells expressing the reporter gene integrated into their genomes. (C) Number of PLA spots versus integrated fluorescence intensity in the nuclei of single cells. Red circles, cells in the absence of doxycycline (expressing the reporter), blue spots, data from cells indicated in the image in (B), and green circles, cells in the presence of doxycycline (no expression from the reporter). (D) Distribution of c-fos/c-jun heterodimers from the endogenous gene in unmodified HeLa cells (not the clone discussed above) in the nuclei of 75 cells 6 h after serum induction. Source data for this figure is available on the online supplementary information page.

