Figure 7.
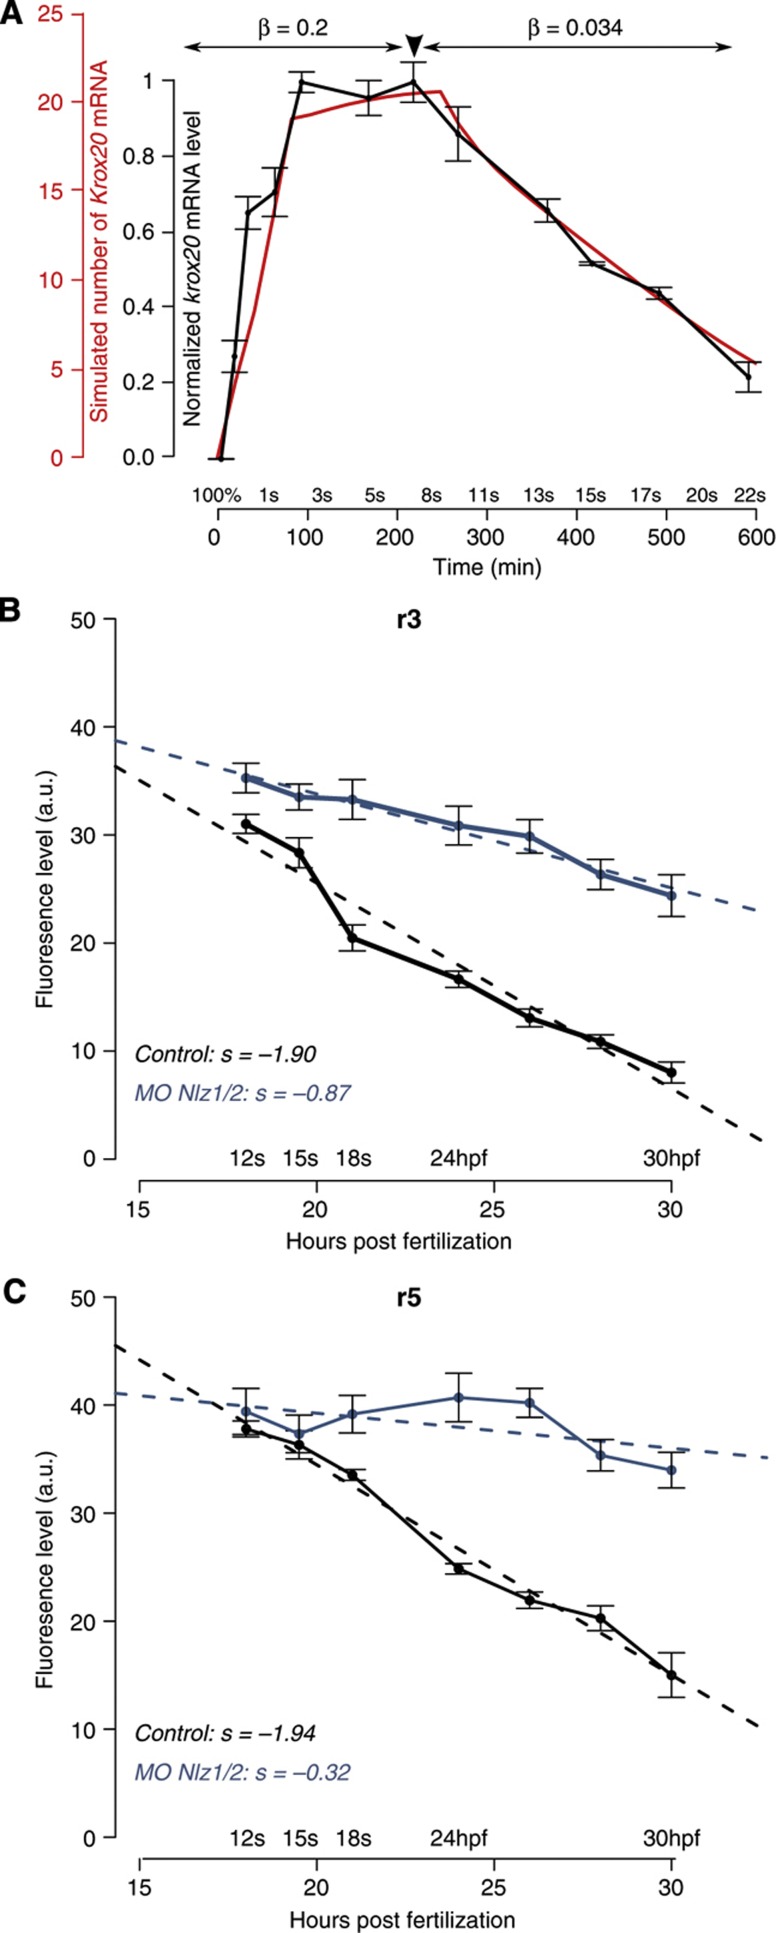
Role of Nlz factors in the destabilization of the autoregulatory loop. (A) The experimental time course of krox20 expression (grey) can be fully recapitulated by the model if a 6.2-fold reduction in the β-factor is introduced at t=250 min (red). (B, C) Time course of krox20 expression in r3 (B) and r5 (C) measured by fluorescent in-situ hybridization in embryos injected with control (grey) or nlz1/2 morpholinos (blue). hpf, hours post fertilization; s, slope. Source data for this figure is available on the online supplementary information page.

