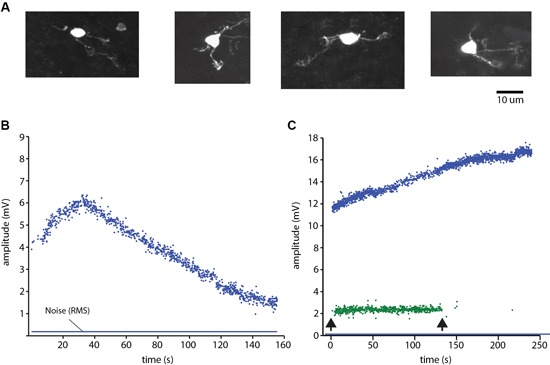
Figure 3.

Granule cell identification. (A) Examples of morphologically identified granule cells recovered from the sublobule C1. (B) Plot of the peak to peak amplitude of a spike recording of a granule cell in cell-attached mode. Note the variation over time of the spike amplitude. Blue line indicates the root mean square of the noise level of the recordings. Spike activity was evoked by ongoing coLF stimulation. (C) Single electrode-parallel recording of a Golgi cell (blue) and a granule cell (green) (Bengtsson and Jorntell, 2009a; Bengtsson et al., 2013). Arrows indicate onset and offset, respectively, of the coLF stimulation.
