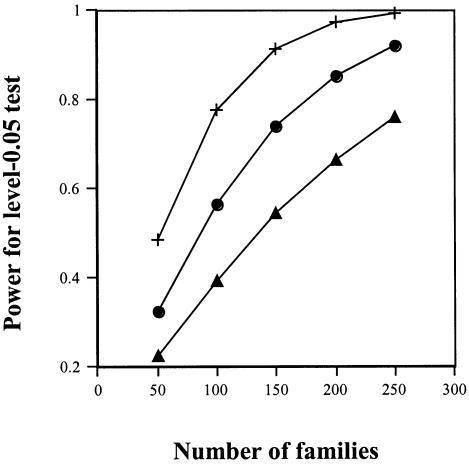
Figure 2.
Power for R1=2, R2=3, S1=1, and S2=1, for the 1-df grandparents test (middle curve) (i.e., test 2) as compared with the 1-df parents test (lowest curve) and the 1-df grandparents test (with C as predictor variable) in the presence of a maternal-effect background (upper curve) where S1=1.5 and S2=2.0. (Prevalence of variant allele is 0.05, with no population stratification.)

