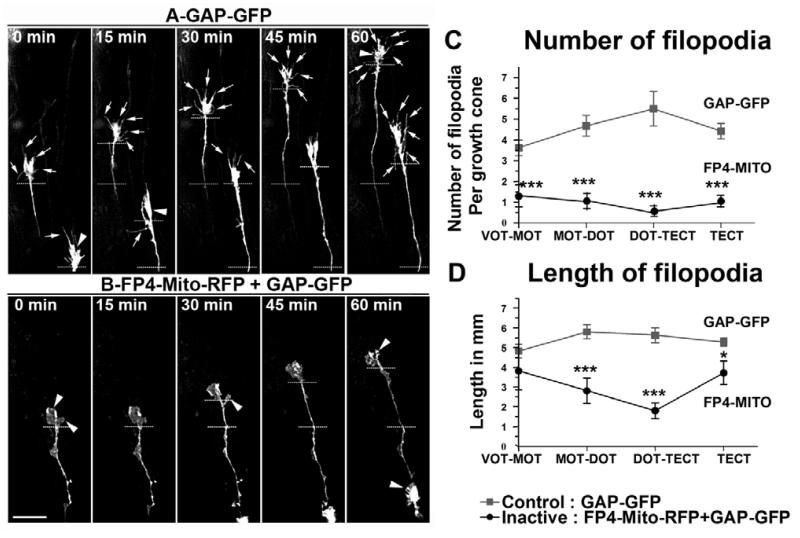
Fig. 2. Depletion of Xena/XVASP function affects growth cone dynamics in vivo.
(A,B) In vivo time-lapse sequences over 1 hour (sequential pictures taken at 15-minute intervals) of growth cones growing along the optic tract of control neurons expressing GAP-GFP (A) or FP4-Mito-RFP+GAP-GFP-expressing neurons (B). Arrows point to filopodia and arrowheads to lamellipodia; dashed lines indicate growth cone progression between sequential pictures. (C,D) The number of filopodia (C) and the length of filopodia (D) of retinal axon growth cones expressing either GAP-GFP or FP4-Mito (mean±s.e.m. from a sample of 15 retinal axons). Measurements were performed along the visual pathway: from the ventral to the medial optic tract (VOT-MOT), from the medial to the dorsal optic tract (MOT-DOT), at the tectum border (DOT-TECT) and inside the tectum (TECT). *P<0.05; ***P <0.001, FP4-Mito-expressing growth cones compared with control growth cones in corresponding segments of the visual pathway. Scale bar: 22 μm in B for A,B.

