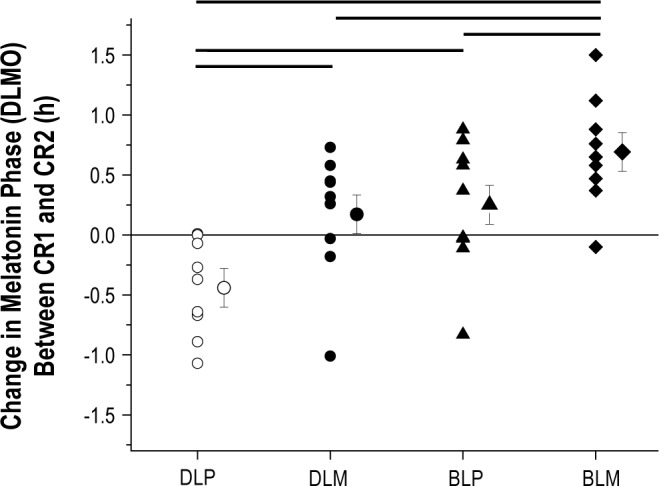
Figure 2.

Phase resetting response to bright light and melatonin. On the y-axis, phase advances are plotted as positive values and phase delays are plotted as negative values with a value of zero representing no phase shift. Plotted are phase shifts for individual subjects within each condition as well as the condition mean ± SEM. DLP, dim light-placebo; DLM, dim light-melatonin; BLP, bright light-placebo; BLM, bright light-melatonin. Thicker lines above plot represent significant effects between conditions at either end of the line (P < 0.05). On average, DLM, BLP, and BLM induced ∼37 min, ∼42 min, and ∼68 min phase advances relative to DLP, respectively.
