

Abstract
Study Objectives:
To determine polysomnographic parameter differences in children living at higher altitude to children living near sea level.
Design and Setting:
Prospective study of non-snoring, normal children recruited from various communities around Denver, CO. In-lab, overnight polysomnograms were performed at a tertiary care children's hospital. All children required residence for greater than one year at an elevation around 1,600 meters.
Participants:
45 children (62% female), aged 3-5 years, 88.9% non-Hispanic white with average BMI percentile for age of 47.8% ± 30.7%.
Measurements and Results:
Standard sleep indices were obtained and compared to previously published normative values in a similar population living near sea level (SLG). In the altitude group (AG), the apnea-hypopnea index was 1.8 ± 1.2 and the central apnea-hypopnea index was 1.7 ± 1.1, as compared to 0.9 ± 0.8 and 0.8 ± 0.7, respectively, (P ≤ 0.005) in SLG. Mean end-tidal CO2 level in AG was 42.3 ± 3.0 mm Hg and 40.6 ± 4.6 mm Hg in SLG (P = 0.049). The ≥ 4% desaturation index was 3.9 ± 2.0 in AG compared to 0.3 ± 0.4 in SLG (P < 0.001). Mean periodic limb movement in series index was 10.1 ± 12.3 in AG and 3.6 ± 5.4 in SLG (P = 0.001).
Conclusion:
Comparison of altitude and sea level sleep studies in healthy children reveals significant differences in central apnea, apneahypopnea, desaturation, and periodic limb movement in series indices. Clinical providers should be aware of these differences when interpreting sleep studies and incorporate altitude-adjusted normative values in therapeutic-decision making algorithms.
Citation:
Burg CJ; Montgomery-Downs HE; Mettler P; Gozal D; Halbower AC. Respiratory and polysomnographic values in 3- to 5-year-old normal children at higher altitude. SLEEP 2013;36(11):1707-1714.
Keywords: Polysomnography, sleep, respiratory, child, normal subjects, altitude
INTRODUCTION
Sleep disordered breathing (SDB) is very common and is associated with poor health and cognitive outcomes in children. Problems such as failure to thrive, pulmonary hypertension, poor cognition, poor school performance, and psychiatric/ behavioral problems have been reported.1–9 Reports on the prevalence of obstructive sleep apnea (OSA) in children range from 2% to 4%.10 However, no studies have been done at elevations significantly higher than sea level. The absence of such data makes it difficult to determine what is abnormal at different ages when sleep evaluations are conducted at altitude, and thus, uncertainty is present as to the thresholds that will guide treatment recommendations.
About 6% to 8% of the world's population (400-500 million) live at elevations above 1,600 meters.11 Children who live at elevations around 1,600 meters breathe air that has (relatively) 17% less oxygen than at sea level. The barometric pressure at 1,600 meters above sea level is about 640 mm Hg and the theoretical PAO2 is 72 mm Hg, corresponding to an estimated O2 saturation of 93% under normal physiological conditions. Since the altitude-induced hypoxia will lead to hyperventilation, the corrected PAO2 will be about 81 mm Hg, corresponding to an O2 saturation of 94% to 95% if no alveolar to arterial (A-a) differences exist. With time, changes in 2,3-DPG, increased hemoglobin concentrations, and adjustments in actual A-a gradient occur, leading to an oxygen saturation a few percentage points higher than calculated.12 Oxyhemoglobin saturation may occasionally drop during sleep in normal children at sea level.13–16 Moreover, it is well documented that chronic or intermittent hypoxia increases the risk for adverse developmental, behavioral, and academic achievement effects in well-designed and controlled studies in children with congenital heart disease and SDB.1,17 Thus, concerns about such adverse effects of hypoxia should be taken into account for any children who are exposed to hypoxemic events, even when such events are mild in nature. Children, like adults, experience reduced oxyhemoglobin saturation levels and associated hyperventilation when acutely exposed to higher elevation.18,19 Over time, physiological adaptations take place, leading to return to baseline respiratory breathing patterns. However, documentation on when this acclimatization occurs, or if there is “normalization” of other parameters that are typically measured during sleep (e.g., end-tidal CO2, periodic leg movements, central apneas) has not been systematically pursued.
Polysomnography (PSG) is increasingly being used in the evaluation of children with SDB. Guidelines for diagnosing SDB in children are based on a handful of studies defining normal PSG parameters performed at lower elevations (near sea level).13–16 Even fewer studies are available after the American Academy of Sleep Medicine (AASM) changed scoring rules in 2007.20–22 Criteria for obstructive sleep apnea in adults are not applicable to children.23 There is significant variation in what is considered normal for end-tidal CO2 levels during sleep, and the measurement techniques for end-tidal CO2 have not been uniform. Equally important, the normative values for apnea-hypopnea index (AHI), arousal index, and ≥ 4% vs. ≥ 3% desaturation index vary greatly across sleep laboratories.13–16,20 We are unaware of any criteria with which to define “normal” among sleep labs located at higher elevations. Studies on normal oximetry in children at altitude are available,24–31 but most of these studies have reported SpO2 values in the awake state. Information on other data reported by PSG to define SDB is limited in both the adult and pediatric literature.32 Sleep labs resort to “local rules” to define what is normal without the benefit of objectively collected and validated evidence. Considering the known lower baseline saturations in children living at altitude, this population may be at risk for complications associated with hypoxia. For these reasons, normative data on sleep in children at altitude is imperative to guide clinical evaluation and prevent overdiagnosis and overtreatment in this population.
METHODS
Subjects
This was a comparison study of non-snoring, healthy 3- to 5-year-old children recruited from communities residing at an altitude between 1,550 m and 1,650 m (Denver, CO) for at least 1 year, compared to reference values for normal children living near sea level in the literature (< 200 m).15 The research protocol was approved by the Colorado Multiple Institutional Review Board (Protocol #09-0621). Informed consent was obtained from the parents. Healthy subjects were recruited from the general community by means of advertisements placed in Denver metro pediatrician offices, in public places around Denver, in preschools, via email to people interested in research and in the newspaper. Standard overnight, in-lab PSGs were performed at one testing site for one night.
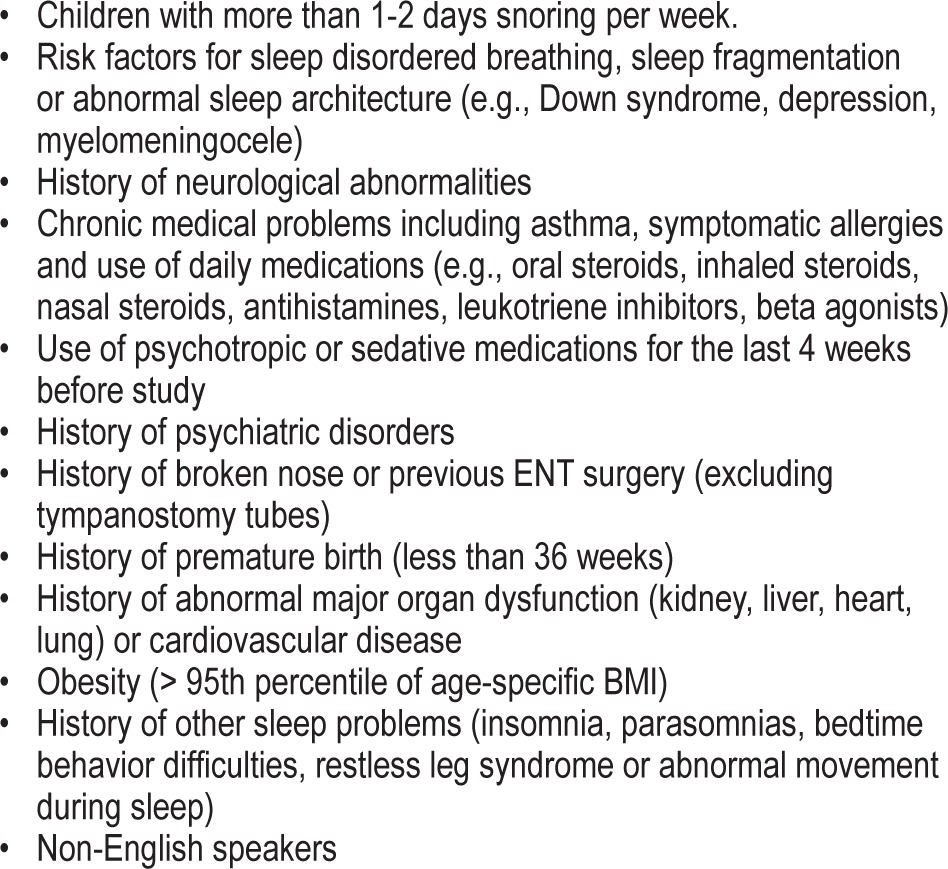
Exclusion criteria included significant medical conditions, use of any medication, and any signs of a sleep disorder (Table 1). In addition, children with snoring or those who met criteria for obesity (BMI > 95% for age) were excluded. All screening histories, physical examinations and consents were obtained by the primary investigator at the time of enrollment. Consent included agreement to allow medical record review, which was performed after enrollment. A focused physical exam (nasal, tonsils, airway, lungs, and heart) and screening vital signs (height, weight, respiratory rate, heart rate, temperature, and oxygen saturation) were performed at either the time of enrollment or at the time of sleep study. Based on review of medical records and screening histories, anyone meeting exclusion criteria was removed from the study.
Table 1.
Exclusion criteria
Enrolled and studied children from altitude were compared to a similar age-matched group from a previously published paper by Montgomery-Downs et al. at a near sea level location.15 This single comparison study was chosen because of the large number of subjects included, the quality of the evidence (level 1-2), and to enable strict matching of subjects such that accurate statistical comparisons could be performed.
Polysomnography
One trained polysomnographic technician, using standard AASM-defined techniques,33 performed overnight sleep study on all subjects, using a computer-based system (Sandman Elite; Embla Systems LLC, Thornton, CO). Standard measurements included: referential electroencephalograms (EEG) F4M1, F3M2, C4M1, C3M2, O2M1, O1M2, submental surface electromyogram (EMG), referential electroculograms (E1M2 and E2M1), bipolar surface EMG from the right and left anterior tibialis muscles (Grass SAFELEAD, Grass Technologies, West Warwick, RI), electrocardiogram (ECG), heart rate from pulse oximetry, nasal pressure (PTAF2, Pro-Tech Services Inc., Makilteo, WA), oral/nasal flow thermistor (Sandman Breath-Sensor, Nellcor Puritan Bennett Ltd., Ottawa, ON), rib cage and abdominal movements via respiratory inductive plethysmography belts (Multi-RIP Sleep Sense, S.L.P Ltd, Tel-Aviv, Israel), oxygen saturation (Masimo Radical-7, Masimo Corp, Irvine, CA & internal Nellcor OxiMax, Tyco, Pleasanton, CA), end-tidal CO2 (Capnogard, Respironics, Carlsbad, CA), snoring, body position, and time-synchronized digital video. Behavior was observed and recorded by the PSG technician. Equipment similar to that used by Montgomery-Downs was employed in obtaining these measurements. However, it is notable that the current study used a mainstream sampling CO2 monitor, while the Montgomery-Downs study used a side-stream sampling type.15 A parent remained in the same room as the child throughout the testing. Children noted to be “sick” (by parent report or noted on physical exam) at time of sleep study were rescheduled to have the study done at a time when they were well. Recent travel (within past 2 weeks) to elevations lower than 1,500 m was also a reason to reschedule the study.
Analysis of Polysomnogram
To exclude interscorer variability, a single, registered polysomnographic technician (RPSGT), certified in research scoring, scored all studies visually using AASM guidelines,33 and a single American Board of Pediatrics certified sleep physician reviewed all scored studies.
Sleep architecture was assessed and reported by standard techniques. Arousals, awakenings and leg movements were all scored according to AASM rules.33 Arousal associations were reported as: (1) arousals within 5 sec of the termination of an apnea or hypopnea (respiratory arousal); (2) leg movement arousals when there was < 0.5 sec between the end of one event and the onset of the other event regardless of which occurred first; and (3) spontaneous arousal when not associated with leg movement, apnea, or hypopnea.
Oxyhemoglobin desaturations were automatically scored by Sandman software, with visual verification by the scoring technician (movement artifact was marked for exclusion on analysis). Two separate pulse oximeters (internal Nellcor OxiMax and external Masimo Radical-7) were used to verify saturations in all subjects. The averaging time was set to 2 sec for the Masimo unit and factory set at 2-3 sec on the internal Nellcor equipment. Desaturations were considered only if they started during a stage of sleep (not wake). The ≥ 3% desaturation index was calculated as number of ≥ 3% desaturations / TST × 60, and the ≥ 4% desaturation index was calculated as number of ≥ 4% desaturations / TST × 60.
AASM criteria for scoring respiratory events was used.33 Respiratory events were scored initially with ≥ 3% desaturations and then rescored based on ≥ 4% desaturations for accurate comparison to published normative data.15 The nasal pressure transducer was used to score hypopneas, while the nasal/oral thermistor was used to detect apneas. Apneas were scored if the event lasted ≥ 2 breaths (based on baseline breathing during current sleep stage) and had a > 90% fall in signal amplitude for ≥ 90% of the entire respiratory event. They were classified as obstructive if there was continued or increased inspiratory effort throughout the entire period of decreased flow and/or if snoring/paradox was present. They were classified as mixed if there was absent inspiratory effort in the initial portion of the event, followed by resumption of inspiratory effort before the end of the event. They were classified as central if associated with absent inspiratory effort throughout the entire duration of the event and (1) lasted ≥ 20 sec or (2) was associated with an arousal or a desaturation (even if followed by a snore, sigh, other respiratory event, or arousal). Both ≥ 3% and ≥ 4% desaturation events were scored. Hypopneas were scored if the event lasted ≥ 2 missed breaths and ≥ 50% fall in the amplitude of the nasal pressure signal occurred for ≥ 90% of the entire event length, along with an associated arousal or desatu-ration (both ≥ 3% and ≥ 4%). Hypopneas were further classified as “obstructive” if respiratory effort appeared preserved or was associated with snoring, paradoxical breathing, or signs of increased work of breathing noted. They were classified as central hypopneas if no paradoxical breathing, snoring, or increased respiratory effort was noted and the effort belts appeared decreased.
Periodic breathing was scored if there were ≥ 3 episodes of absent respiratory effort lasting > 3 seconds separated by no more than 20 sec of normal breathing. If some of these periods of absent respiratory effort met criteria for central apnea, they were not scored (i.e. periodic breathing did not overlap with central apneas, so events were not considered twice). Percent time in periodic breathing was calculated as: time in periodic breathing / TST × 100.
CO2 levels were obtained from end-tidal monitoring. These were incorporated into the digital record, and calculations of mean and time in ranges were calculated based on TST. Sampling of both nasal pressure and end-tidal CO2 was obtained via a divided nasal cannula (Salter Labs, 4702; Arvin, CA); with flow from one nostril going to PTAF and flow from the other nostril going to end-tidal CO2 monitor. CO2 waveform was analyzed during scoring to determine adequacy of signal and values with poor signal (no plateau and/or respiratory rate not matching other channels) were excluded. End-tidal values were considered valid if they were in the ranges of 30-60 mm Hg. Values outside of this range were not considered when calculating reported indices and values.
Data Analysis
In collaboration with 2 of the authors of the Montgomery-Downs study,15 statistical analysis of the full data set was possible. The exclusion criteria (periodic leg movement index ≥ 5 and obstructive apnea-hypopnea index ≥ 1)15 were applied to subjects from the current study to create a subgroup of 18 subjects for comparison purposes.
The distribution of each variable was evaluated using histograms for the subjects from each study. Variables that were highly skewed were compared using the Mann-Whitney U test. Other variables were compared using the Student's t-test for independent measures. Data were analyzed using SAS version 9.3. P-values of < 0.05 were considered significant.
Periodic leg movements were of particular interest, and therefore additional unpublished data were obtained from the Montgomery-Downs study15 for 43 previously excluded subjects with periodic leg movement index ≥ 5. A total of 216 subjects from the previous study were compared to all 45 subjects of the current study.
We examined associations between respiratory event indices (total and obstructive apnea-hypopneas) and snoring and tonsil size using one-way ANOVA. Student's t-test for independent measures was used to assess for differences in these indices between subjects with different Mallampati scores and presence versus absence of mouth breathing.
A linear regression was used to evaluate the association between respiratory event indices and BMI.
RESULTS
All Subjects Studied at Altitude (N = 45)
Fifty-three non-snoring subjects (based on parental report) were enrolled. Eight voluntarily withdrew from the study, leaving 45 children who were studied (62% female). Average age was 4.4 years (range 3.0-5.9 years), 89% were non-Hispanic white, 4% were Hispanic white, and 4% were black, reflecting local demographics. Demographic and anthropometric data on current and comparison subjects are noted in Table 2. TST, sleep efficiency, sleep latency, REM latency, and sleep architecture for the full complement of subjects at altitude, along with historic studies on pediatric reference subjects are reported in Table 3. This table also reports on arousal data, PLMS index, oxygen saturation, CO2 distribution, and standard respiratory indices. There were 28 subjects studied with mild snoring and 4 subjects with moderate snoring as witnessed on video and subjectively classified by the research polysomnographic technician. Analysis of the potential associations between clinical signs (snoring, Mallampati score, tonsil size, and mouth breathing) and respiratory indices were performed. There were no significant associations with either total AHI or obstructive AHI (see Table S1). A linear regression model used to compare BMI percentiles for age to both total AHI and obstructive AHI, revealed no significant associations (P = 0.637 and 0.417, respectively).
Table 2.
Demographic and anthropometric variables

Table 3.
Sleep parameter comparison charta

PLMS index was significantly different in the altitude group (N = 45, median: 5.4, 10th-90th percentiles: 0.0-29.1) compared to Montgomery-Downs unpublished subjects (N = 216, median: 2.0, 10th-90th percentiles: 0.0-10.4, P < 0.001) as noted in Table 3 with graphic representation in Figure 1.
Figure 1.

Periodic leg movements at altitude and at sea level.
Subgroup of Subjects Studied at Altitude for Comparison with Sea Level Controls (N = 18)
For comparison to subjects in the Montgomery-Downs study, 27 children with an obstructive apnea-hypopnea index ≥ 1.0 and/or a PLMS index ≥ 5.0 were excluded. This left 18 altitude subjects for comparisons with 173 sea level subjects. Respiratory indices are reviewed in Table 4. The AHI in the altitude subgroup (mean: 1.8, SD: 1.2) was higher than the sea level AHI (mean: 0.9, SD: 0.8, P = 0.004). The central AHI in the altitude subgroup (mean: 1.7, SD: 1.1) and the obstructive AHI (median: 0.2, 10th-90th percentiles: 0.0-0.6) were statistically different from those measured at sea level (central AHI – mean: 0.9, SD: 0.8 and obstructive AHI – median: 0.0, 10th-90th percentiles: 0.0-0.3, P = 0.005 and < 0.001, respectively).
Table 4.
Respiratory event comparisons (based on oxygen saturation drop ≥ 4%)

Oxyhemoglobin saturation comparisons are presented in Table 5. Mean oxyhemoglobin saturations, oxyhemoglobin saturation nadir, and percent of TST with oxyhemoglobin saturations > 95% were all lower in the altitude subgroup, while the ≥ 4% desaturation index and percent of TST with oxyhemoglobin saturations between 90% and 95% were higher (all P values < 0.001). CO2 comparisons of the altitude subgroup to sea level group are in Table 6. Time spent above 45 mm Hg during sleep and above 50 mm Hg was not different, but the mean end-tidal CO2 was higher at 42.3 mm Hg (SD: 3.0) in the altitude subgroup compared to sea level at 40.6 mm Hg (SD: 4.6, P = 0.049).
Table 5.
Oxygen saturation (SpO2)
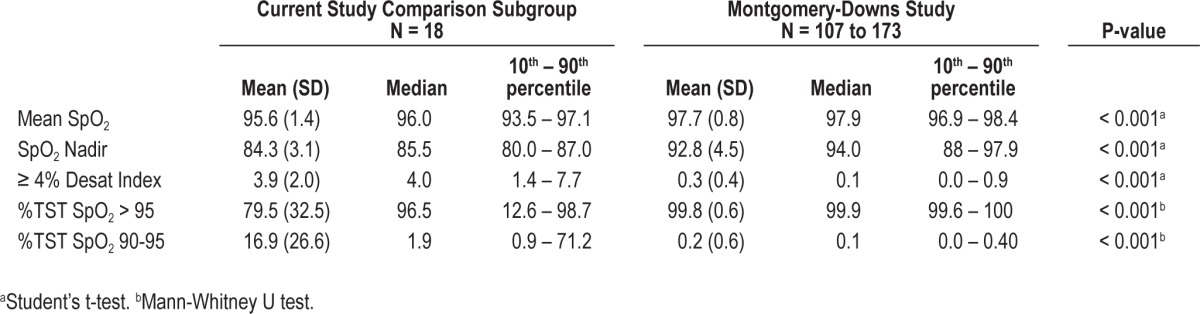
Table 6.
End-tidal CO2 (ETCO2) comparisons

DISCUSSION
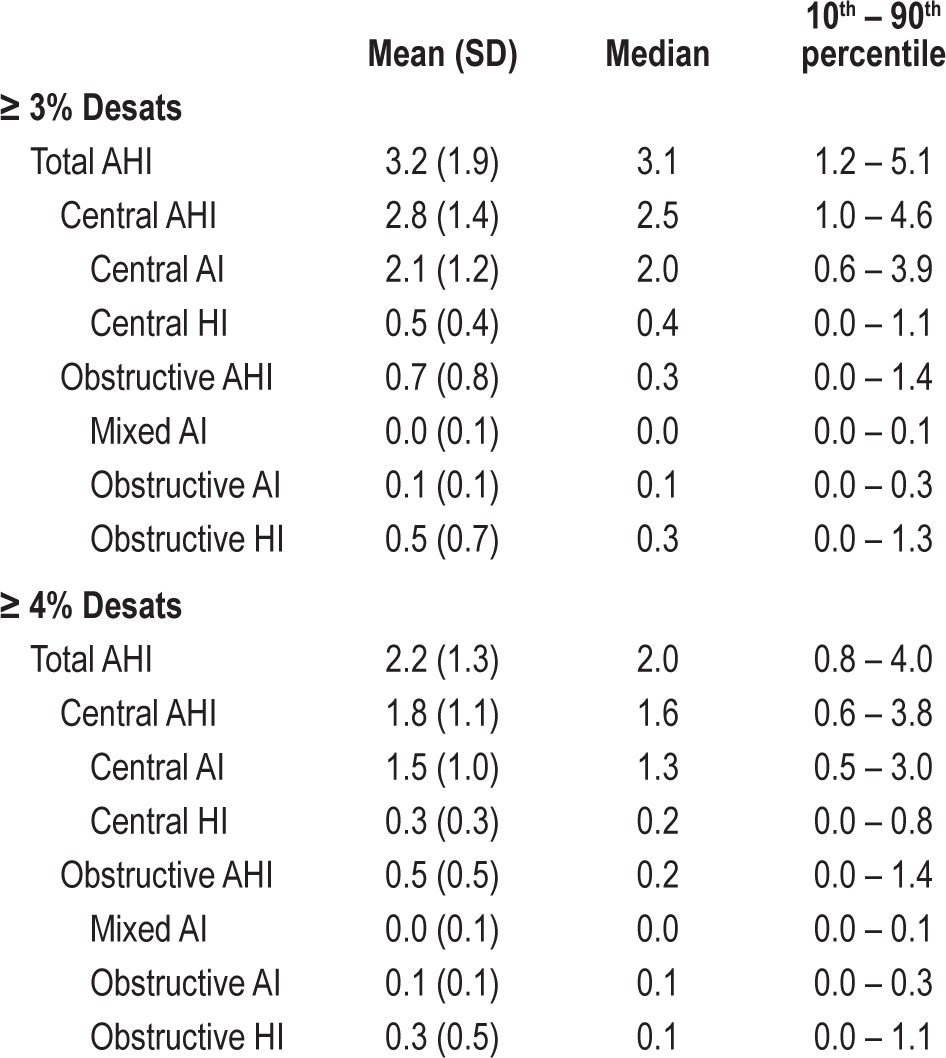
The results of this study comprise the first report of normal sleep parameters in children aged 3-5 years who live at higher elevation. This study reveals significant differences in regards to central apneas, obstructive apneas, and hypopneas when compared to normative data obtained at sea level. The majority of the differences noted are due to scored events defined in part by a drop in oxygen saturation (i.e., hypopneas and central apneas). As presented in Table 7, the difference in the various indices when using ≥ 4% desaturation vs. ≥ 3% desaturation is high and could change whether a child is labeled as having obstructive sleep apnea or is reported as “normal.”
Table 7.
Respiratory indices (N = 45)
The contribution of increased central events is significant when interpreting the AHI. Indications for treatment have typically been reported in regards to the AHI.34 The data presented in this paper would suggest that using an “obstructive” AHI (OAHI) for surgical treatment decisions would be more appropriate. The data also suggest that classification of hypopneas into central and obstructive events would be appropriate. Although the AASM rules recommend esophageal manometry or calibrated respiratory inductance plethysmography (RIP) as methods to discriminate central from obstructive events, we chose to score central events based on appearance of a drop in all channels and classified them as central hypopneas. Whether central apneas and hypopneas are related to cardiovascular or neuropsychological detriment is unknown. Data are very limited in this regard, especially when CO2 levels remain within the normal ranges.35 In our study, if all hypopneas were classified as obstructive, it would increase the obstructive AHI by 0.5 events per hour.
With acclimatization to higher altitude, slight changes in blood pH, 2,3-diphosphoglycerate and hemoglobin concentration shift the oxyhemoglobin dissociation curve such that it is difficult to determine PaO2 values from oxygen saturations. Control of ventilation is determined by both the levels of CO2 (PaCO2 and cerebrospinal H+) and PaO2, and their interactions with each other. Although controlled for in this study, acute changes in altitude (differences between where a person lives and where the sleep study is performed) can affect this central control of ventilation dramatically. There is evidence that acclimated people living at higher elevations have a blunted ventilatory response to hypoxemia, which will manifest as deeper oxyhemoglobin desaturations before ventilator output increases.36 Deeper and more frequent drops in oxyhemoglobin saturation, due to small changes in PaO2, likely accounts for the increased frequency of central apneas and hypopneas in our population. For these reasons, the AASM-based rules would not hold the same applicability at altitude.
Although there was a statistically significant difference in mean end-tidal CO2 levels, this is not likely to be of clinical significance. Furthermore, the percent of TST with end-tidal CO2 above 45 and 50 mm Hg between the two groups was not significantly different. The low variability of measured end-tidal CO2 in our study likely represents the choice of the measurement technology and the close monitoring of the signal during acquisition. However, there are data to support that tight regulation of CO2 levels (narrow CO2 reserve) in a hypoxic environment occurs.35,37 The putative mechanism likely involves increased respiratory stimulation by up-regulation of the carotid chemoreceptors to hypoxia.38 This tight regulation may also account for a portion of the increased central apneas as the apneic CO2 threshold is crossed following sighs and arousals.
A surprising finding was the higher frequency of periodic limb movements during sleep. Changes in PLM scoring methodologies (updated AASM rules) have occurred in the time between the Montgomery-Downs and the current study that could lead to differences in detection threshold. It has been reported that low serum iron stores (ferritin < 50 ng/mL) have been associated with low cerebrospinal iron levels and can contribute to periodic limb movement disorder by affecting the dopamine metabolism pathways.39,40 It has also been shown that increased erythropoiesis occurs in individuals who live at higher elevations,41,42 a process that requires iron utilization. Another mechanism that could potentially account for lower iron levels is the activation of the hypoxic pathway that drives iron uptake by mitochondria.43 Increased respiratory events have been linked with elevated periodic limb movements,44 and our elevated respiratory indices could also explain some of the increase in the PLMS index. However, our mean arousal index during TST remains similar to sea-level norms. Young children typically do not report symptoms of leg pain, and frequent arousals due to leg movements may go unnoticed by parents. These considerations therefore warrant further investigation of PLMs in young children.
We were unable to find a correlation between the AHI or obstructive AHI and tonsil size, BMI percentile, witnessed snoring, mouth breathing, or Mallampati score. This would support the literature in showing that history, physical exam, and screening questionnaires are poor predictors of sleep apnea.
Although we attempted to exclude snoring children, the majority of children studied had at least “mild” snoring (71%) and 4 of 45 had moderate snoring. This “quantification” of snoring is, however, not validated and there were some visual signs that the acquisition equipment (mainly the nasal cannula) may have been causing some nasal occlusion, resulting in increased upper airway resistance. Since the absence of “habitual snoring” per parental report does not necessarily negate the possibility of “actual snoring” being recorded and documented during a polysomnogram, these subjects were not excluded. Furthermore, the presence of snoring did not correlate with the AHI values (Table S1).
Limitations to our study include: (1) A limited ethnic diversity that may limit applicability in the general population. (2) We did not have calibrated plethysmography or an esophageal pressure manometer as suggested by the AASM to classify hypopneas as obstructive vs. central.33 (3) As children were investigated for only one night, there is obviously the potential that a “first night effect” may play a role in our findings. There is evidence to support night-to-night differences in periodic limb movements,45 but the night-to-night variability in respiratory events is less likely to be significant.46
Future studies aiming to investigate periodic limb movements at altitude are required. An evaluation with ferritin levels and subsequent ferrous sulfate treatment would help answer the question if iron depletion is the cause for the elevated PLMS index at higher altitude. As this study begins to explain changes at 1,600 m, characterization of children who live at even higher elevations would likely show even more extreme differences and warrants investigation. Studies have shown that the frequency of central apneas change as children age,20 and therefore, studies in older children living at altitude would be of interest. We present data that shows increased oxyhemoglobin desaturation events, increased leg movements, lower oxyhemoglobin saturations, and overall higher AHI in otherwise healthy children living at higher elevation. However, we do not know the effect this has on their neuropsychological or cardiovascular health, and studies evaluating this would be helpful. Practitioners taking care of children with sleep concerns need to be aware of the various differences in normal respiratory parameters in unique environmental groups of children before any diagnosis and subsequent treatment plans are devised.
DISCLOSURE STATEMENT
This was not an industry supported study. Dr. Gozal is a scientific consultant for Galleon Pharmaceuticals on respiratory control and a recipient of investigator-initiated grant from ResMed Medical Corporation for study on urinary biomarkers in adult sleep apnea. The other authors have indicated no financial conflicts of interest. This study was supported in part by NIH/NCRR Colorado CTSI Grant Number UL1 RR025780. Dr. Gozal is supported by NIH grant HL-65270. Contents are the authors' sole responsibility and do not necessarily represent official NIH views.
SUPPLEMENTAL MATERIAL
Associations (N = 45)
REFERENCES
- 1.Halbower AC, Mahone EM. Neuropsychological morbidity linked to childhood sleep-disordered breathing. Sleep Med Rev. 2006;10:97–107. doi: 10.1016/j.smrv.2005.10.002. [DOI] [PubMed] [Google Scholar]
- 2.Gozal D. Sleep-disordered breathing and school performance in children. Pediatrics. 1998;102:616–20. doi: 10.1542/peds.102.3.616. [DOI] [PubMed] [Google Scholar]
- 3.Ali NJ, Pitson D, Stradling JR. Sleep disordered breathing: effects of adenotonsillectomy on behaviour and psychological functioning. Eur J Pediatr. 1996;155:56–62. doi: 10.1007/BF02115629. [DOI] [PubMed] [Google Scholar]
- 4.Goldstein NA, Fatima M, Campbell TF, Rosenfeld RM. Child behavior and quality of life before and after tonsillectomy and adenoidectomy. Arch Otolaryngol Head Neck Surg. 2002;128:770–5. doi: 10.1001/archotol.128.7.770. [DOI] [PubMed] [Google Scholar]
- 5.Owens J, Opipari L, Nobile C, Spirito A. Sleep and daytime behavior in children with obstructive sleep apnea and behavioral sleep disorders. Pediatrics. 1998;102:1178–84. doi: 10.1542/peds.102.5.1178. [DOI] [PubMed] [Google Scholar]
- 6.Stradling JR, Thomas G, Warley AR, Williams P, Freeland A. Effect of adenotonsillectomy on nocturnal hypoxaemia, sleep disturbance, and symptoms in snoring children. Lancet. 1990;335:249–53. doi: 10.1016/0140-6736(90)90068-g. [DOI] [PubMed] [Google Scholar]
- 7.Guilleminault C, Winkle R, Korobkin R, Simmons B. Children and nocturnal snoring: evaluation of the effects of sleep related respiratory resistive load and daytime functioning. Eur J Pediatr. 1982;139:165–71. doi: 10.1007/BF01377349. [DOI] [PubMed] [Google Scholar]
- 8.Brouillette RT, Fernbach SK, Hunt CE. Obstructive sleep apnea in infants and children. J Pediatr. 1982;100:31–40. doi: 10.1016/s0022-3476(82)80231-x. [DOI] [PubMed] [Google Scholar]
- 9.Hunt CE, Brouillette RT. Abnormalities of breathing control and airway maintenance in infants and children as a cause of cor pulmonale. Pediatr Cardiol. 1982;3:249–56. doi: 10.1007/BF02240461. [DOI] [PubMed] [Google Scholar]
- 10.Standards and indications for cardiopulmonary sleep studies in children. American Thoracic Society. Am J Respir Crit Care Med. 1996;153:866–78. doi: 10.1164/ajrccm.153.2.8564147. [DOI] [PubMed] [Google Scholar]
- 11.Cohen JE, Small C. Hypsographic demography: the distribution of human population by altitude. Proc Natl Acad Sci U S A. 1998;95:14009–14. doi: 10.1073/pnas.95.24.14009. [DOI] [PMC free article] [PubMed] [Google Scholar]
- 12.Taussig LM, Landau LI. Pediatric respiratory medicine. 2nd ed. Philadelphia: Mosby/Elsevier; 2008. [Google Scholar]
- 13.Marcus CL, Omlin KJ, Basinki DJ, et al. Normal polysomnographic values for children and adolescents. Am Rev Respir Dis. 1992;146:1235–9. doi: 10.1164/ajrccm/146.5_Pt_1.1235. [DOI] [PubMed] [Google Scholar]
- 14.Traeger N, Schultz B, Pollock AN, Mason T, Marcus CL, Arens R. Polysomnographic values in children 2-9 years old: additional data and review of the literature. Pediatr Pulmonol. 2005;40:22–30. doi: 10.1002/ppul.20236. [DOI] [PubMed] [Google Scholar]
- 15.Montgomery-Downs HE, O'Brien LM, Gulliver TE, Gozal D. Polysomnographic characteristics in normal preschool and early school-aged children. Pediatrics. 2006;117:741–53. doi: 10.1542/peds.2005-1067. [DOI] [PubMed] [Google Scholar]
- 16.Uliel S, Tauman R, Greenfeld M, Sivan Y. Normal polysomnographic respiratory values in children and adolescents. Chest. 2004;125:872–8. doi: 10.1378/chest.125.3.872. [DOI] [PubMed] [Google Scholar]
- 17.Bass JL, Corwin M, Gozal D, et al. The effect of chronic or intermittent hypoxia on cognition in childhood: a review of the evidence. Pediatrics. 2004;114:805–16. doi: 10.1542/peds.2004-0227. [DOI] [PubMed] [Google Scholar]
- 18.Yaron M, Niermeyer S, Lindgren KN, Honigman B, Strain JD, Cairns CB. Physiologic response to moderate altitude exposure among infants and young children. High Alt Med Biol. 2003;4:53–9. doi: 10.1089/152702903321488988. [DOI] [PubMed] [Google Scholar]
- 19.Yaron M, Lindgren K, Halbower AC, Weissberg M, Reite M, Niermeyer S. Sleep disturbance after rapid ascent to moderate altitude among infants and preverbal young children. High Alt Med Biol. 2004;5:314–20. doi: 10.1089/ham.2004.5.314. [DOI] [PubMed] [Google Scholar]
- 20.Scholle S, Wiater A, Scholle HC. Normative values of polysomnographic parameters in childhood and adolescence: cardiorespiratory parameters. Sleep Med. 2011;12:988–96. doi: 10.1016/j.sleep.2011.05.006. [DOI] [PubMed] [Google Scholar]
- 21.Scholle S, Beyer U, Bernhard M, et al. Normative values of polysomnographic parameters in childhood and adolescence: quantitative sleep parameters. Sleep Med. 2011;12:542–9. doi: 10.1016/j.sleep.2010.11.011. [DOI] [PubMed] [Google Scholar]
- 22.Scholle S, Wiater A, Scholle HC. Normative values of polysomnographic parameters in childhood and adolescence: Arousal events. Sleep Med. 2012 doi: 10.1016/j.sleep.2011.07.022. [DOI] [PubMed] [Google Scholar]
- 23.Rosen CL, D'Andrea L, Haddad GG. Adult criteria for obstructive sleep apnea do not identify children with serious obstruction. Am Rev Respir Dis. 1992;146:1231–4. doi: 10.1164/ajrccm/146.5_Pt_1.1231. [DOI] [PubMed] [Google Scholar]
- 24.Subhi R, Smith K, Duke T. When should oxygen be given to children at high altitude? A systematic review to define altitude-specific hypoxaemia. Arch Dis Child. 2009;94:6–10. doi: 10.1136/adc.2008.138362. [DOI] [PubMed] [Google Scholar]
- 25.Balasubramanian S, Suresh N, Raeshmi R, Kaarthigeyan K. Comparison of oxygen saturation levels by pulse oximetry in healthy children aged 1 month to 5 years residing at an altitude of 1500 metres and at sea level. Ann Trop Paediatr. 2008;28:267–73. doi: 10.1179/146532808X375422. [DOI] [PubMed] [Google Scholar]
- 26.Reuland DS, Steinhoff MC, Gilman RH, et al. Prevalence and prediction of hypoxemia in children with respiratory infections in the Peruvian Andes. J Pediatr. 1991;119:900–6. doi: 10.1016/s0022-3476(05)83040-9. [DOI] [PubMed] [Google Scholar]
- 27.Beebe SA, Heery LB, Magarian S, Culberson J. Pulse oximetry at moderate altitude. Healthy children and children with upper respiratory infection. Clin Pediatr. 1994;33:329–32. doi: 10.1177/000992289403300603. [DOI] [PubMed] [Google Scholar]
- 28.Duke T, Blaschke AJ, Sialis S, Bonkowsky JL. Hypoxaemia in acute respiratory and non-respiratory illnesses in neonates and children in a developing country. Arch Dis Child. 2002;86:108–12. doi: 10.1136/adc.86.2.108. [DOI] [PMC free article] [PubMed] [Google Scholar]
- 29.Onyango FE, Steinhoff MC, Wafula EM, Wariua S, Musia J, Kitonyi J. Hypoxaemia in young Kenyan children with acute lower respiratory infection. BMJ. 1993;306:612–5. doi: 10.1136/bmj.306.6878.612. [DOI] [PMC free article] [PubMed] [Google Scholar]
- 30.Muhe L, Webert M. Oxygen delivery to children with hypoxaemia in small hospitals in developing countries. Int J Tuberc Lung Dis. 2001;5:527–32. [PubMed] [Google Scholar]
- 31.Gamponia MJ, Babaali H, Yugar F, Gilman RH. Reference values for pulse oximetry at high altitude. Arch Dis Child. 1998;78:461–5. doi: 10.1136/adc.78.5.461. [DOI] [PMC free article] [PubMed] [Google Scholar]
- 32.Pagel JF, Kwiatkowski C, Parnes B. The effects of altitude associated central apnea on the diagnosis and treatment of obstructive sleep apnea: comparative data from three different altitude locations in the mountain west. J Clin Sleep Med. 2011;7:610–5A. doi: 10.5664/jcsm.1462. [DOI] [PMC free article] [PubMed] [Google Scholar]
- 33.Iber C, Ancoli-Israel S, Chesson A. Westchester, IL: American Academy of Sleep Medicine; 2007. Quan SF for the American Academy of Sleep Medicine. The AASM manual for the scoring of sleep and associated events: rules, terminology, and technical specifications. [Google Scholar]
- 34.Mindell JA, Owens JA. 2nd ed. Philadelphia: Wolters Kluwer Health/Lippincott Williams & Wilkins; 2010. A clinical guide to pediatric sleep: diagnosis and management of sleep problems. [Google Scholar]
- 35.Javaheri S. Central sleep apnea. Clin Chest Med. 2010;31:235–48. doi: 10.1016/j.ccm.2010.02.013. [DOI] [PubMed] [Google Scholar]
- 36.Weil JV, Byrne-Quinn E, Sodal IE, Filley GF, Grover RF. Acquired attenuation of chemoreceptor function in chronically hypoxic man at high altitude. J Clin Invest. 1971;50:186–95. doi: 10.1172/JCI106472. [DOI] [PMC free article] [PubMed] [Google Scholar]
- 37.Nakayama H, Smith CA, Rodman JR, Skatrud JB, Dempsey JA. Effect of ventilatory drive on carbon dioxide sensitivity below eupnea during sleep. Am J Respir Crit Care Med. 2002;165:1251–60. doi: 10.1164/rccm.2110041. [DOI] [PubMed] [Google Scholar]
- 38.Joseph V, Pequignot JM. Breathing at high altitude. Cell Mol Life Sci. 2009;66:3565–73. doi: 10.1007/s00018-009-0143-y. [DOI] [PMC free article] [PubMed] [Google Scholar]
- 39.Simakajornboon N, Gozal D, Vlasic V, Mack C, Sharon D, McGinley BM. Periodic limb movements in sleep and iron status in children. Sleep. 2003;26:735–8. doi: 10.1093/sleep/26.6.735. [DOI] [PubMed] [Google Scholar]
- 40.Earley CJ, Connor JR, Beard JL, Malecki EA, Epstein DK, Allen RP. Abnormalities in CSF concentrations of ferritin and transferrin in restless legs syndrome. Neurology. 2000;54:1698–700. doi: 10.1212/wnl.54.8.1698. [DOI] [PubMed] [Google Scholar]
- 41.Weil JV, Jamieson G, Brown DW, Grover RF. The red cell mass--arterial oxygen relationship in normal man. Application to patients with chronic obstructive airway disease. J Clin Invest. 1968;47:1627–39. doi: 10.1172/JCI105854. [DOI] [PMC free article] [PubMed] [Google Scholar]
- 42.Dirren H, Logman MH, Barclay DV, Freire WB. Altitude correction for hemoglobin. Eur J Clin Nutr. 1994;48:625–32. [PubMed] [Google Scholar]
- 43.Chepelev NL, Willmore WG. Regulation of iron pathways in response to hypoxia. Free Radic Biol Med. 2011;50:645–66. doi: 10.1016/j.freeradbiomed.2010.12.023. [DOI] [PubMed] [Google Scholar]
- 44.Exar EN, Collop NA. The association of upper airway resistance with periodic limb movements. Sleep. 2001;24:188–92. doi: 10.1093/sleep/24.2.188. [DOI] [PubMed] [Google Scholar]
- 45.Hornyak M, Kopasz M, Feige B, Riemann D, Voderholzer U. Variability of periodic leg movements in various sleep disorders: implications for clinical and pathophysiologic studies. Sleep. 2005;28:331–5. [PubMed] [Google Scholar]
- 46.Katz ES, Greene MG, Carson KA, et al. Night-to-night variability of polysomnography in children with suspected obstructive sleep apnea. J Pediatr. 2002;140:589–94. doi: 10.1067/mpd.2002.123290. [DOI] [PubMed] [Google Scholar]
Associated Data
This section collects any data citations, data availability statements, or supplementary materials included in this article.
Supplementary Materials
Associations (N = 45)