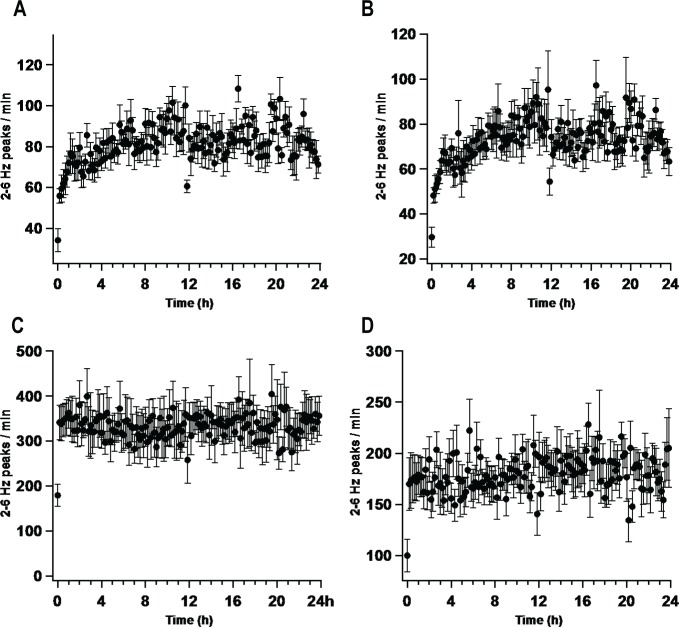
Figure 7.
Period-amplitude analysis was performed by band-pass filtering (2-6 Hz) EEG signals from the frontal-interparietal derivation. Peaks in the filtered data were detected as negative deflections between two zero crossings. The amplitude (maximum negative deflection from zero crossing) of all peaks detected in an entire 24-h period were then determined. (A, B) The upper 30% of peak amplitudes that occurred in epochs scored as wake were then counted and expressed as peaks per min (wave incidence). Other peak-amplitude cutoffs did not result in wake-dependent increases in wave incidence. (C) No amplitude cutoff. (D) Upper 60% of peaks. (A) High variability was found in short durations of wake. These short durations, less than 10 epochs, were excluded from analysis. (B) A similar 24-h pattern of wave incidence was observed when these shorter wake epochs were included in the analysis.

