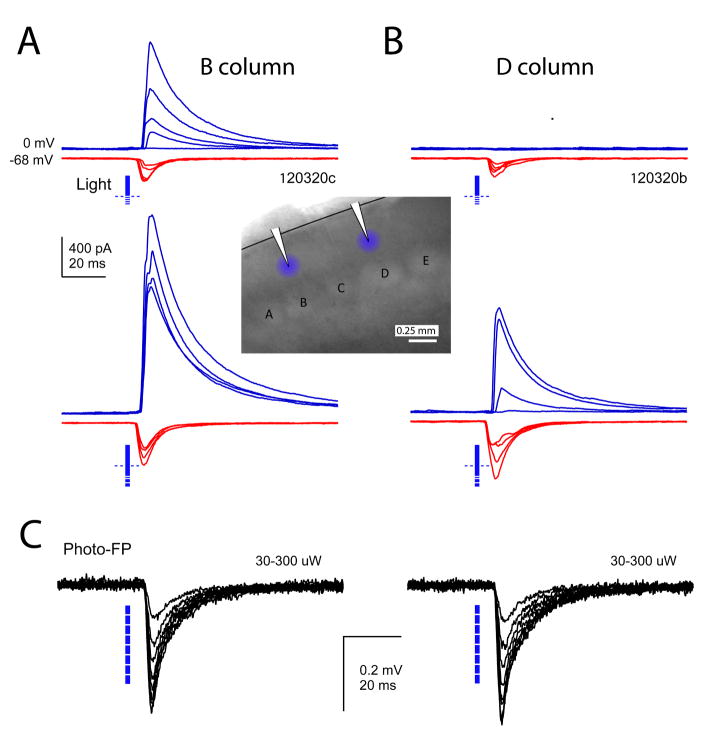
Figure 4. Effect of D-row deprivation on two representative cells in B and D columns of a single slice.
A and B, IPSCs and EPSCs recorded in response to 1.0 – 1.4 x Ethresh (top) and 1.5, 1.6, 1.8, and 2.0 x Ethresh (bottom). Inset, recording and photostimulus locations for these two neurons. C, Photocurrent-LFPs recorded at the location of each neuron in the presence of TTX, kynurenic acid and picrotoxin. Photocurrent-LFPs were recorded in response to the same series of photostimulation intensities (30–300 μW), and were identical in both columns.

