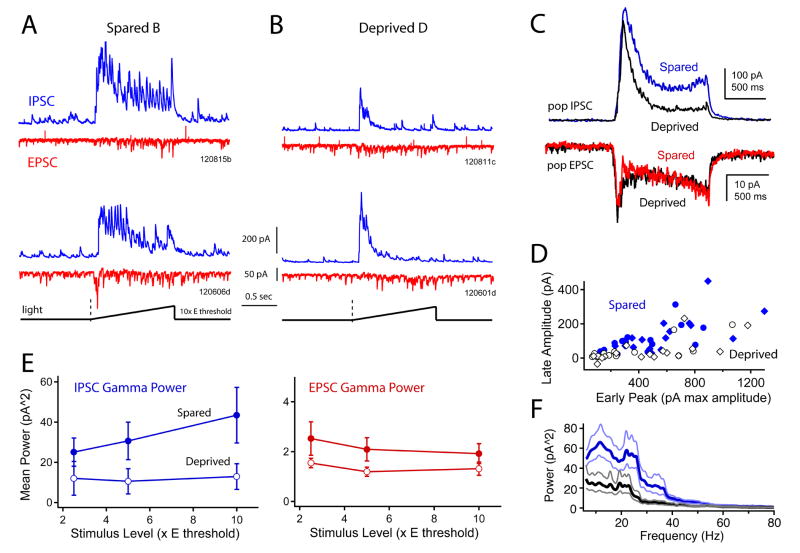
Figure 6. Effect of deprivation on intrinsic gamma oscillations evoked by ramp photostimulation.
A, Two example B column cells, showing EPSCs and IPSCs evoked by a light ramp to 10 x Ethresh. Each trace is a single sweep. B, Two example D column cells, using the identical light ramp. C, Population mean EPSC and IPSC in spared (B) vs. deprived (D) columns, calculated for 10 x Ethresh stimuli. D, Effect of deprivation on early IPSC amplitude vs. late IPSC amplitude (0–0.3 and 0.3–1.2 s after ramp onset). Each symbol is one cell tested at 5 x Ethresh (circles) or 10 x Ethresh (diamonds). E, Mean gamma power (20–60 Hz) for late component of IPSCs and EPSCs. Bars are SEM. F, Mean power spectrum for late IPSCs in spared B columns (blue) vs. deprived D columns (black), for 10x Ethresh ramps. See also Figure S3.

