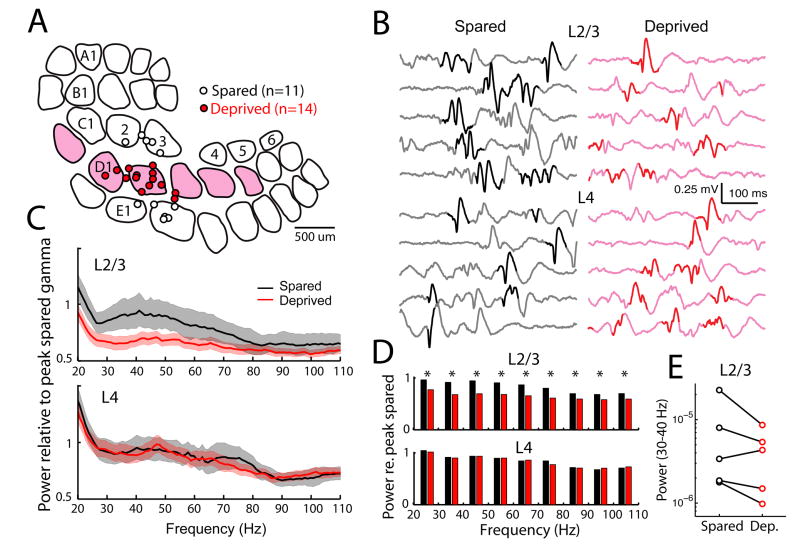
Figure 7. D-row deprivation reduces spontaneous gamma oscillations in L2/3 of anesthetized S1 in vivo.
A, Recording locations for deprived (D) and spared (C and E) penetrations, reconstructed from marking lesions and plotted on representative barrel outlines. Deprived columns are shaded. B, Example raw LFP traces from a spared and a deprived column of one animal. Traces were chosen based on maximum similarity to mean LFP spectra for this animal. Bold indicates LFP segments with highest 40 Hz power (see Methods). C, Mean normalized LFP spectra for spared and deprived columns across all animals. Shading, 99% confidence intervals. D, Mean normalized LFP power in 10-Hz bins. Top, L2/3 recordings. Bottom, L4 recordings. *, p < 0.05, random permutation test. E, Mean LFP power in 30–40 Hz band for L2/3 recordings in each of the 5 rats separately.

