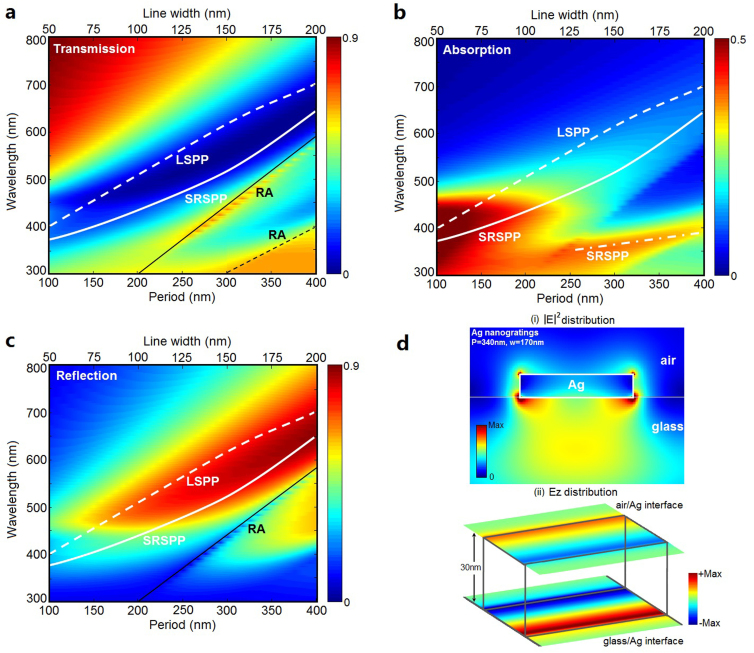
Figure 4. Theoretical clarification of extraordinary low transmission in ultrathin Ag nanogratings.
2D maps of the calculated TM optical transmission (a), absorption (b) and reflection (c) spectra of 30 nm-thick Ag nanogratings as a function of the incident wavelength and grating period, when the duty cycle of the nanogratings is set at 0.5. The solid and dashed black lines refer to RA at glass/Ag and air/Ag interfaces, respectively. The solid and dash-dotted white curves correspond to the analytical dispersion relations for the lowest and higher orders SRSPP modes, respectively. The dashed white line represents the calculated spectral positions of LSPP for single Ag lines with the same line-width as that of nanogratings. (d) Electric field (i) and instantaneous Ez vector (ii) distribution at the air/Ag and glass/Ag interfaces of nanogratings (P = 340 nm) at the resonance wavelength of 610 nm.

