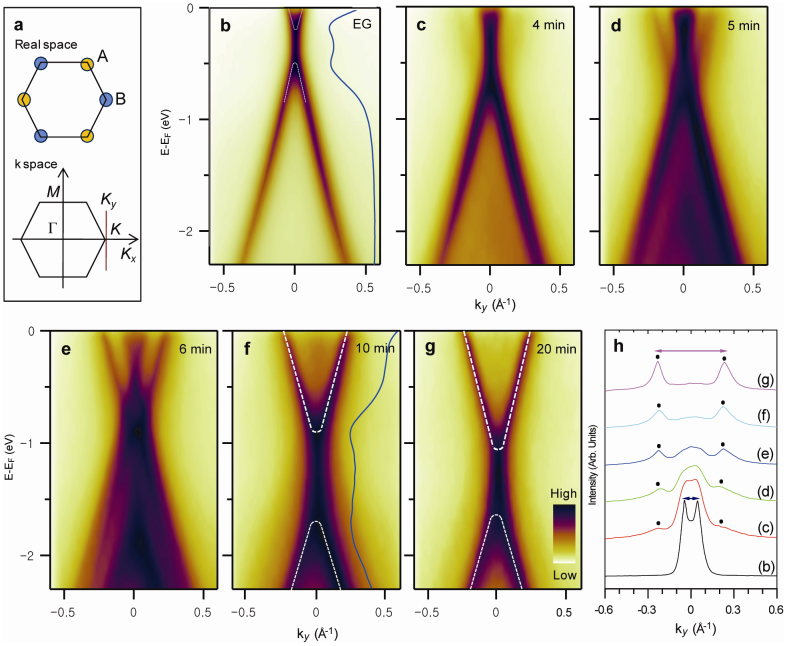
Figure 1. Variations of the electronic band structures of monolayer graphene near the K point with increasing sodium coverage.
(a) Atomic structure and first Brillouine zone of monolayer graphene. (b) ARPES intensity map of the pristine monolayer graphene along the ky direction. (c–g) ARPES intensity maps of the sodium-adsorbed monolayer graphene along the ky direction. In (b–g), the dispersions (white lines) were extracted from the EDC peak positions (see Supplementary Figure S2a), and the blue lines are EDCs obtained at the K point. (h) MDCs at the EF of the ARPES maps in (b–g).

