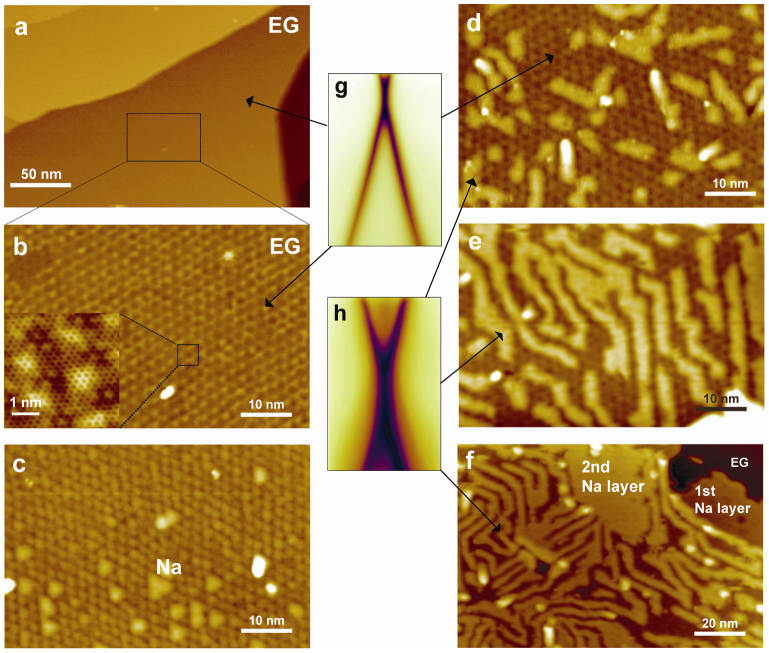
Figure 2. Filled-state STM images of monolayer graphene with increasing sodium coverage compared with the ARPES intensity maps.
(a), (b) STM image of pristine monolayer graphene, where (b) is the enlarged STM image of the rectangular region in (a). (c–f) STM images of sodium-adsorbed monolayer graphene, where the bright images, which originated from the sodium overlayers, are obviously different from the images of the pristine monolayer graphene. (g), (h) ARPES intensity images of pristine (g) and sodium-adsorbed (h) monolayer graphene, where the origins of the STM images of the ARPES intensity maps are indicated by the arrows.

