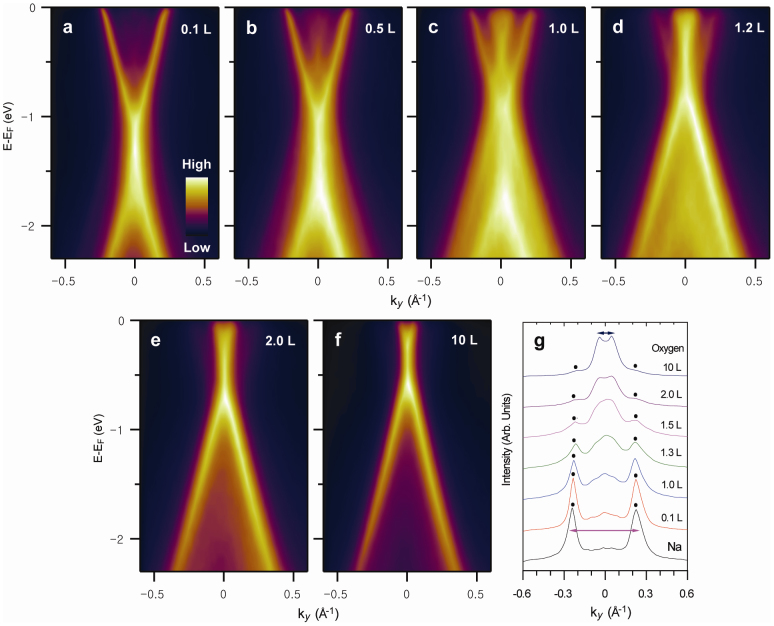
Figure 3. Variations in the electronic band structures of the sodium-covered monolayer graphene near the K point with increasing oxygen exposure.
(a) ARPES intensity map of sodium-adsorbed monolayer graphene with saturated sodium coverage. (b–f) ARPES intensity maps measured after the oxidation of the sodium-adsorbed monolayer graphene with saturated sodium coverage. (g) MDCs at EF of the ARPES maps in (a–f).

