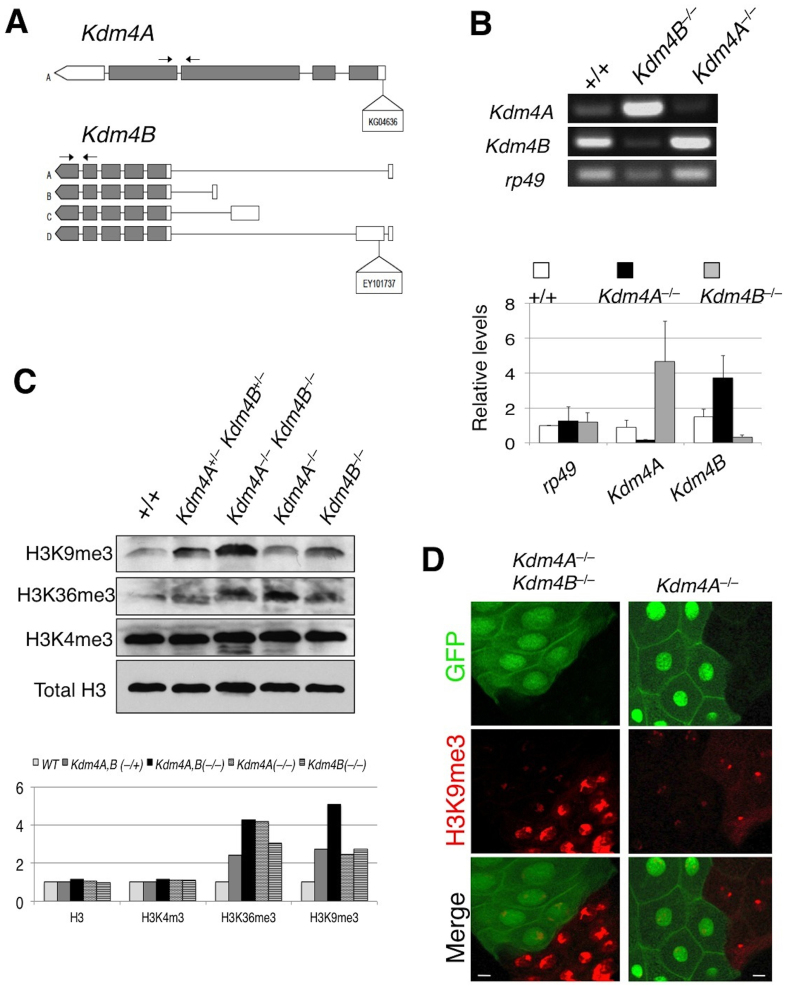
Figure 1. Kdm4A and Kdm4B demethylate H3K9me2,3 in in vivo.
(A) A schematic representation of the Kdm4A and Kdm4B transcripts and P-element insertion site of the strains used. Coding regions are filled in with grey and non-coding regions, in white. Arrows indicate the primer pairs used for RT-PCR analysis. (B) Adult female Kdm4AKG and Kdm4BEY flies were subjected to RT-PCR analysis with primer pairs amplifying Kdm4A and Kdm4B transcripts. Note that each insertional mutation severely reduces the expression of the corresponding gene, and that in each mutant there is compensatory increase in transcript levels of the other gene. (C) Total lysate was prepared from wildtype, Kdm4AKG, BEY heterozygous and homozygous mutant and single homozygous whole early second instar larvae and was subjected in SDS-PAGE, followed by blotting using antibodies against H3K9me3, H3K36me3, and H3K4me2, respectively, with Total H3 serving as a loading control. (D) Kdm4AKG, BEY homozygous double mutant or Kdm4AKG single mutant clones (lack of GFP; green) were induced in early embryos using FRT-mediated somatic recombination (see Methods), then third instar larval salivary glands were dissected and stained with anti-H3K9me2 antibody. Note the dramatically higher levels of H3K9me2 signals in mutant nuclei (GFP−) than in flanking control nuclei (GFP+). Scale bars represent 150 μ.

