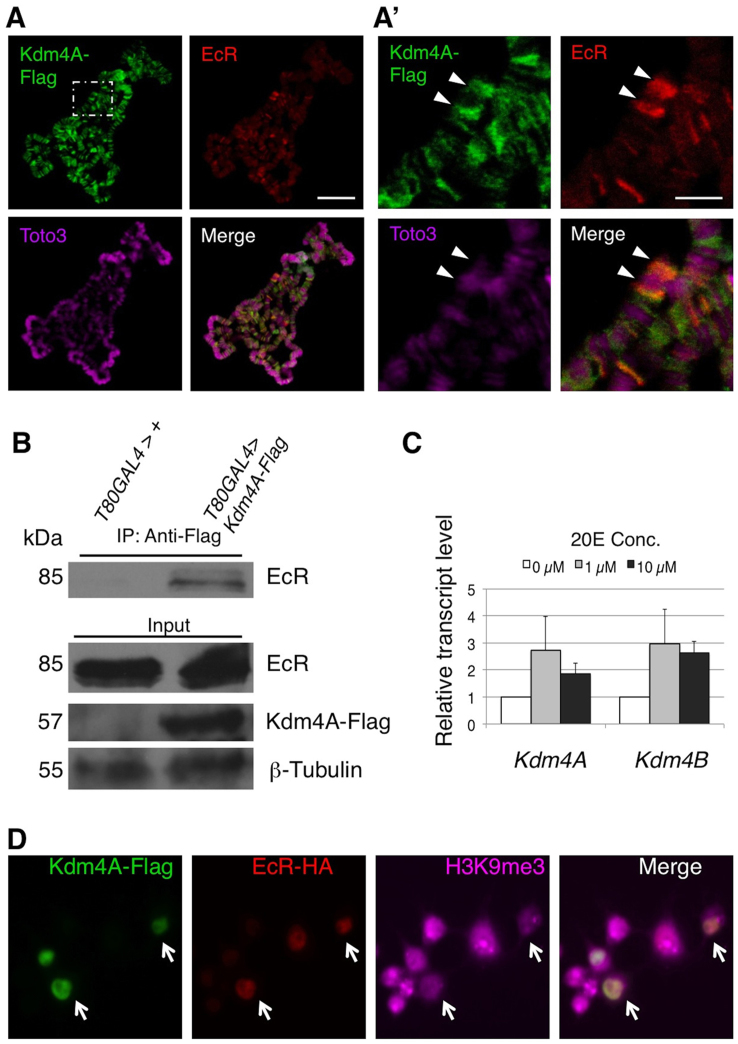
Figure 4. Kdm4A interacts with EcR in vivo.
(A) Flag-tagged Kdm4A was expressed in the salivary gland under the control of the Sgs-GAL4 driver and third instar larval polytene chromosomes were prepared. Immunostaining was performed to visualize the localization of Kdm4A-Flag (green) and EcR (red) on chromosomes, visualized by the DNA dye Toto3 (magenta). The scale bar represents 150 μm. (A′) A higher magnification of a region in A (white dashed line). The Broad (BR-C) locus is indicated with an arrowhead. Note the colocalization of EcR and Kdm4A-Flag signals at the Br-C locus. The scale bar represents 50 μm. (B) UAS-Kdm4A-Flag lines or wildtype control flies were crossed to the ubiquitous T80-GAL4 driver. Protein lysates were prepared from stationary third instar larvae, and immunoprecipitation was done with an anti-Flag antibody. The immunoprecipitates and input lysate were subjected to SDS-PAGE and blotted with anti-EcR common domain, anti-Flag, and anti-β-tubulin antibodies, respectively. (C) S2 cells were treated with,no 20E, or with 1 μM or 10 μM of the hormone. Transcript levels of Kdm4A and Kdm4B were measured by quantitative PCR analysis in triplicate. Error bars represent standard deviation. (D) S2 cells were co-transfected with Kdm4A-Flag and EcR-HA in the presence of 20E. The cells were fixed and immunostained with anti-Flag (green), anti-HA (red), and anti-H3K9me2 (magenta) antibodies. Note that cells expressing both Kdm4A-Flag and EcR-HA exhibit much reduced H3K9me2 signals (white arrows).

