Figure 4.
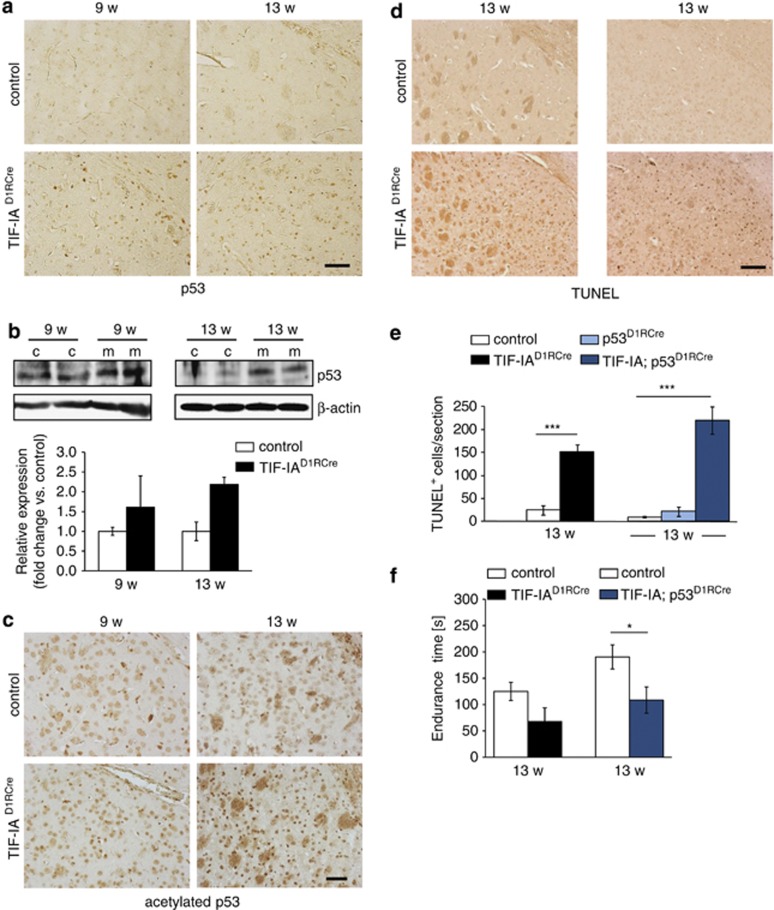
Nucleolar disruption in striatal neurons increases p53 levels and causes neuronal death. (a) Immunohistochemical analysis showing upregulation of p53 protein in 9- and 13-week-old TIF-IAD1RCre mutants. (b) Representative western blots detecting p53 in striatal extracts from control (c) and TIF-IAD1RCre mutants (m) at 9 and 13 weeks. Graphs show quantification of p53 levels relative to β-actin. Values represent means±S.E.M. (9 weeks, n=3; 13w, n=2). (c) Immunohistochemical analysis of striatal brain sections from 9- to 13-week-old mice stained with anti-acetyl-p53 (Lys373,382) antibodies. Scale bars: 60 μm. (d) Analysis of cell death by TUNEL assay in striata of control, TIF-IAD1RCre and TIF-IA;p53D1RCre mutant mice at the age of 13 weeks. Scale bar: 120 μm. (c) Immunohistochemical analysis on striatal brain sections from 9- to 13-week-old mice analyzed by anti-acetylp53 (Lys373,382) antibody in TIF-IAD1RCre mutants and controls. Scale bars: 60 μm. (d) Analysis of cell death by TUNEL assay in striata of control, TIF-IAD1RCre and TIF-IA;p53D1RCre mutants at the age of 13 weeks. Scale bar: 120 μm. (e) Quantification of TUNEL-positive cells within four striatal sections per mouse. Values represent means ±S.E.M. for TIF-IAD1RCre (n=4), TIF-IA;p53D1RCre (n=5), p53D1RCre (n=3) and the respective control mice (n=4–6). (f) Analysis of motor coordination of control, TIF-IAD1RCre and TIF-IA;p53D1RCre mice at 13 weeks analyzed by endurance in the rotarod test. Values for endurance time are means±S.E.M. (n=4–5, sm; n=6–10, dm)

