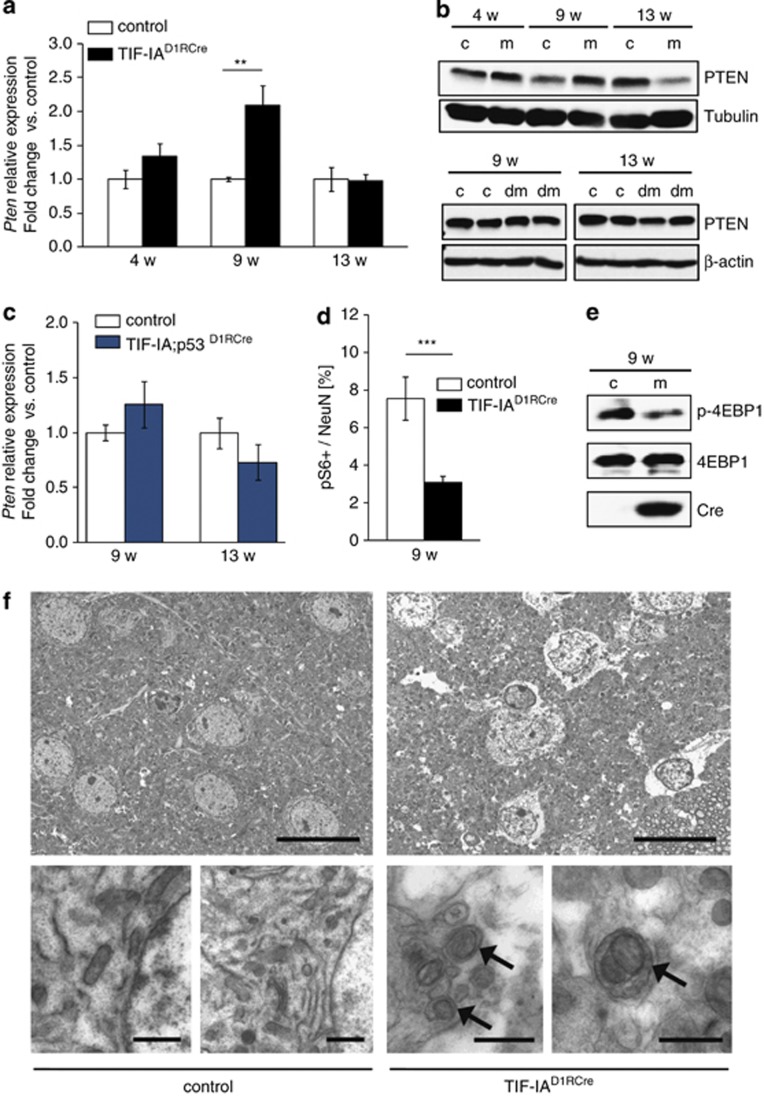
Figure 5.
p53-dependent upregulation of PTEN inhibits mTOR and activates autophagy in MSNs. (a) RT-qPCR analysis of Pten expression in striata from TIF-IAD1RCre mutants (m) and control littermates (c) at different stages. Values represent means±S.E.M. (n=4–5). (b) Representative western blots monitoring striatal PTEN protein levels in control (c), TIF-IAD1RCre (m) and TIF-IA;p53D1RCre (dm) mice at different age. Tubulin or β-actin were used as loading controls. (c) Pten expression analyzed by RT-qPCR using RNA from striata of TIF-IA;p53D1RCre mutants or control mice at 9 and 13 weeks. Values represent means ±S.E.M. (n=3–4). (d) Quantification of the phosphoS6 (pS6)-positive cells relative to the total number of NeuN-positive cells detected by immunostaining of striatal sections (5–8 serial sections per mouse) from controls and TIF-IAD1RCre mutants at 9 weeks. Values represent means ±S.E.M. (n= 3, control; n=4, mutant). (e) Representative western blot showing downregulation of phosphorylated 4EBP1 (p-4EBP1) in TIF-IAD1RCre mutants at 9 weeks of age. (f) Ultrastructural analysis of the striatal tissue in control and mutant mice (9 weeks) by electron microscopy. Left upper and lower panels: cytology of striatal neurons from control animals. Right upper panel: striatal neurons of TIF-IAD1RCre mutants show less electrondense cytoplasm than in the control, indicating reduced density of the endoplasm granular mass as a sign of general cellular impairment. Right lower panel: higher magnification reveals double membrane autophagosomes (arrows) engulfing entire organelles in the mutant. Scale bar in upper panel: 1.8 μm. Scale bar in lower panel: 0.8 μm

