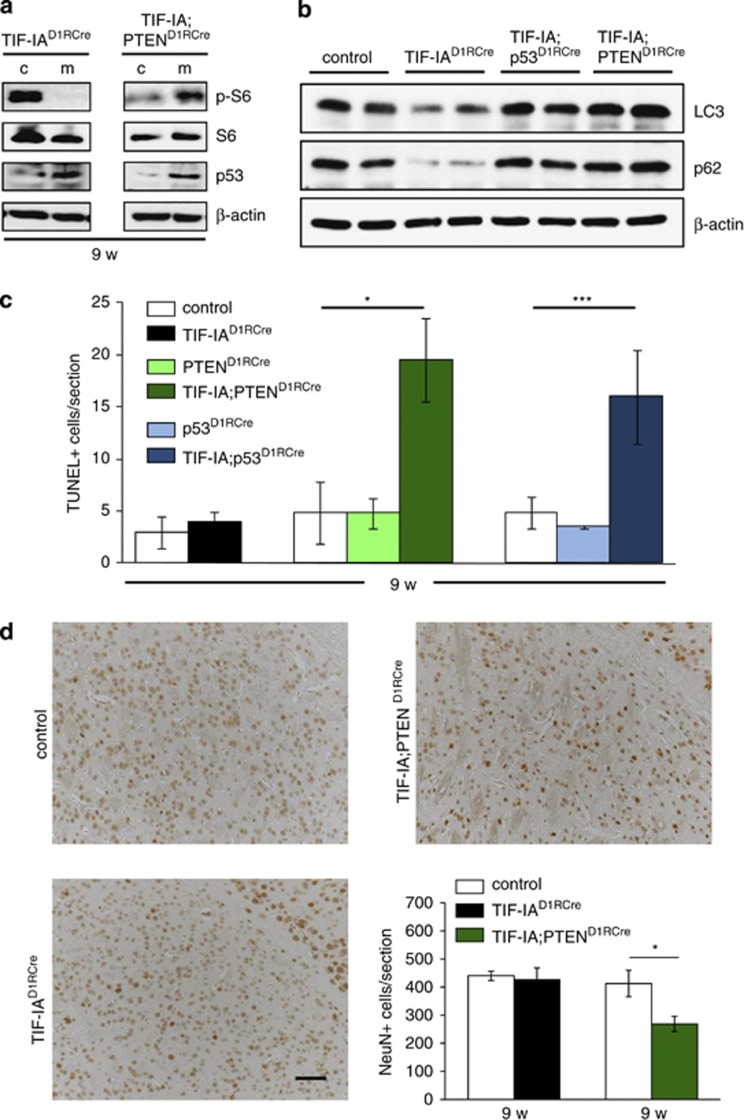
Figure 6.
p53-dependent upregulation of PTEN sustains survival of stress-exposed MSNs. (a) Representative western blots showing the levels of pS6 in striatal extracts from 9-week-old controls, TIF-IAD1RCre (left panel) or TIF-IA;PTEND1RCre (right panel) mutants. For normalization, the total levels of S6 were detected. Levels of p53 and β-actin were also monitored. (b) Representative western blots showing the levels of LC3-I, p62 and β-actin in striatal extracts from 9-week-old control, TIF-IAD1RCre, TIF-IA;p53D1RCre and TIF-IA;PTEND1RCre mice. Note that the LC3-I antibody has no reactivity toward the autophagosome-associated, phosphatidylethanolamine-conjugated LC3-II isoform. (c) Quantification of TUNEL-positive cells monitoring death of MSNs in response to TIF-IA depletion in the presence or absence of p53 or PTEN. The diagram depicts number of TUNEL-positive cells per section (mm2). Bars represent mean values±S.E.M. for TIF-IAD1RCre (n=4), PTEND1RCre (n=4) and p53D1RCre (n=5) single mutants, TIF-IA; PTEND1RCre (n=4) and TIF-IA; p53D1RCre (n=6) double mutants and for the respective control littermates (n=4–6). Striata were analyzed from all animals at 9 weeks. (d) Analysis of NeuN-positive cells by immunohistochemistry in the striatum of 9-week-old control, TIF-IAD1RCre and TIF-IA;PTEND1RCre mice. Scale bar: 60 μm. The diagram on the lower right panel shows the quantification of NeuN-positive cells per section (mm2). Values represent means±S.E.M. (n=4)

