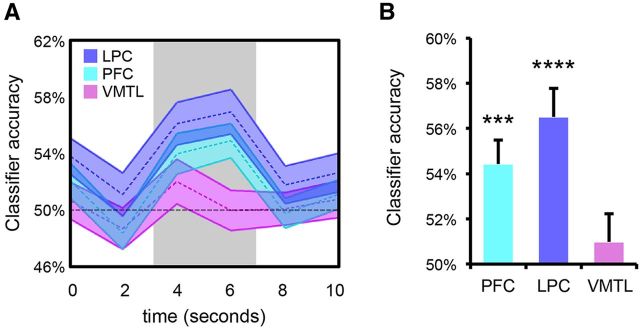
Figure 4.
Decoding of retrieval goals. A, TR-by-TR (shown in seconds) classification accuracy for the category versus location trial classifier for each of the three regions of interest. Shaded area of the time course represents mean ± SEM. B, Same as A, except collapsing across data from TRs 3 and 4 (4 s/6 s; gray rectangle shown in A). Error bars represent SEM; ***p < 0.0005, ****p < 0.00005.

