Figure 1.

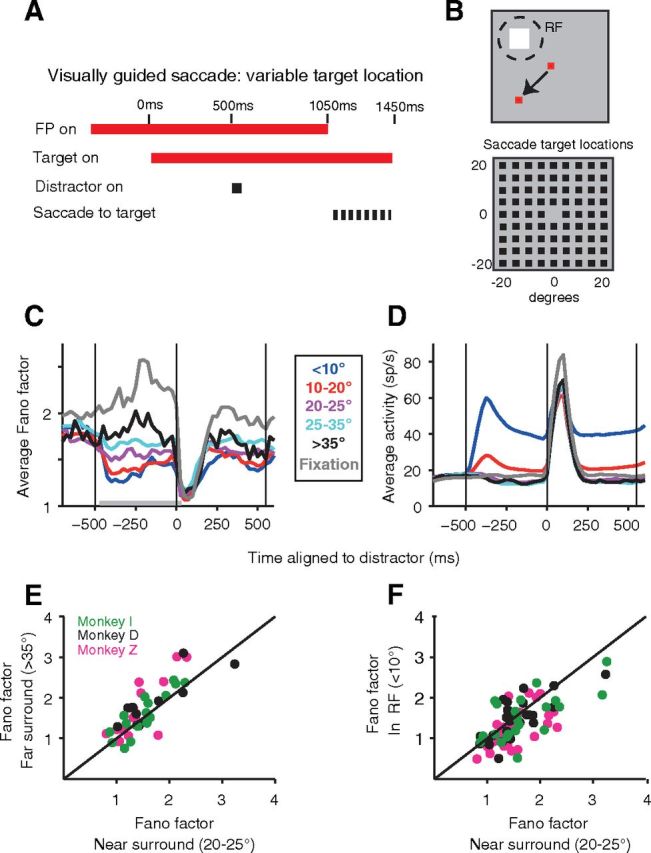
In LIP, the reduction in Fano factor becomes smaller with greater saccade target–RF distance. A, B, Timing (A) and design (B) of target-mapping task. Monkeys made delayed visually guided saccades to saccade targets randomly chosen from a 40° × 40° square grid of locations around the central fixation point (B). A distractor was flashed briefly at the RF center 500 ms into the 1050 ms delay period (see Materials and Methods). The saccade target overlapped the fixation point, and the monkey maintained fixation in control fixation trials. C, Population average PSTF of the Fano factor indicates a greater reduction of the Fano factor in the epoch between target and distractor appearance for smaller target–RF distances (colors indicated in boxed legend). D, Population average PSTHs of the corresponding mean spike rate for the PSTFs plotted in C suggests that the variation in Fano factors beyond 20° is not accompanied by changes in mean spike rate. The PSTF in C and the PSTH in D were calculated in 100 ms windows stepping every 25 ms. Vertical lines in C and D indicate the time of target, distractor, and go-cue onset. E, F, Pairwise comparisons confirm the decrease in Fano factor at smaller target–RF distances: scatter plots of each neuron's Fano factor (average of five non-overlapping 100 ms bins from −470 to 30 ms relative to distractor onset, gray bar in C) comparing saccades to the near surround (abscissa) with those to the far surround (ordinate in E; signed-rank test, p = 0.0047; n = 45) and to the RF (ordinate in F; signed-rank test, p = 0.0006; n = 72 neurons). One point (3.18, 6.01) was omitted from the display in E for better visibility. Green, black, and magenta circles indicate neurons from monkeys I, D, and Z, respectively. Part of B was reproduced with permission from Falkner et al. (2010).
