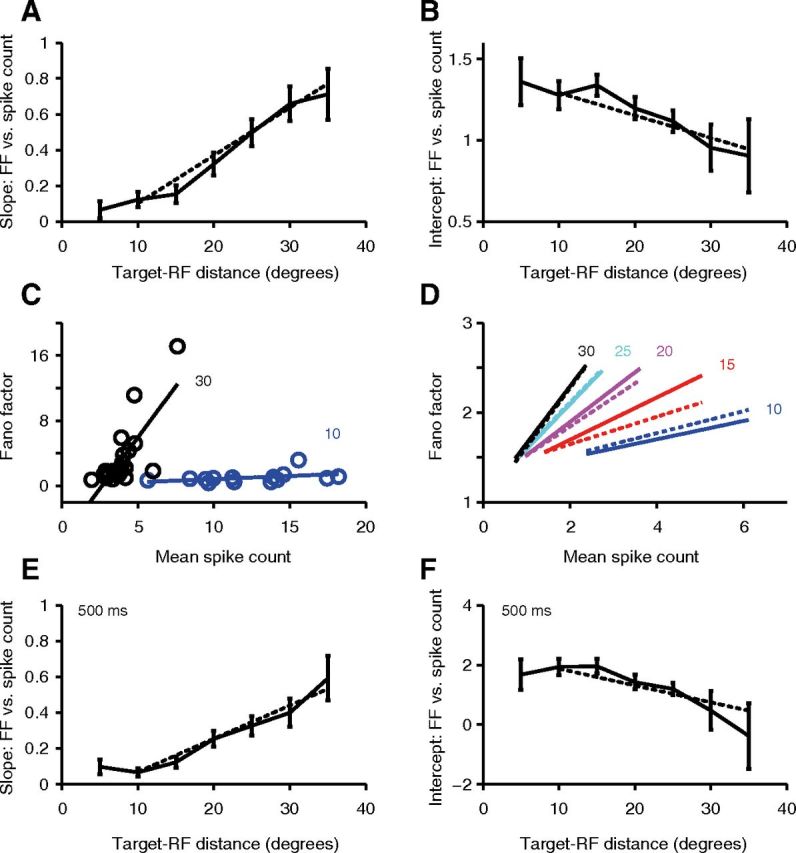
Figure 4.

Target–RF distance interacts with spike rate in a multiplicative manner to affect the Fano factor (FF) in the surround. A, B, Regressing Fano factor on mean spike rate in different target–RF distance windows gives a slope (A) that increases and an intercept (B) that decreases with the distance of the target from the RF center (for targets at least 10° away from the RF center). A, B, Slopes and intercepts as a function of target–RF distance calculated in partially overlapping 10° target–RF distance windows, centered at 5° intervals from 5° to 30° away from the RF center. The final window included only locations >35° away from the RF center. The dotted line is derived by averaging (across neurons) the predicted slope (A) and intercept (B) at each target–RF distance using a single linear multiple-regression model with a multiplicative interaction between spike rate and distance for all saccade target locations at least 10° from the RF center. Error bars represent SEM. Variations of both slope and intercept with distance (solid lines) are statistically significant (Friedman's test, p < 0.0001). C, Single-neuron example of relationship of Fano factor versus mean spike count with superimposed regression line for target locations between 5° and 15° (blue) and between 25° and 35° (black) from the RF center. D, Relationship of Fano factor versus mean spike count for different target–RF distances from 10° to 30° (in steps of 5°), based on the average parameters of the general linear model in the population (solid lines) and the individual regressions for each target–RF distance window (dotted lines). The range of mean spike count values for each line comes from the mean 10–90% range of mean spike count values in the population for target–RF distance windows extending 5° above and below the value for the line. E, F, Identical to A and B respectively, except that the Fano factor was calculated over the entire 500 ms predistractor epoch.
